Mac Apps
iStat Menus 7.50
Mac AppsUpdated
| Requirement | On file |
|---|---|
| macOS | macOS 11 or later |
| CPU | Apple Silicon, Intel 64-bit |
| Download | 23 MB |
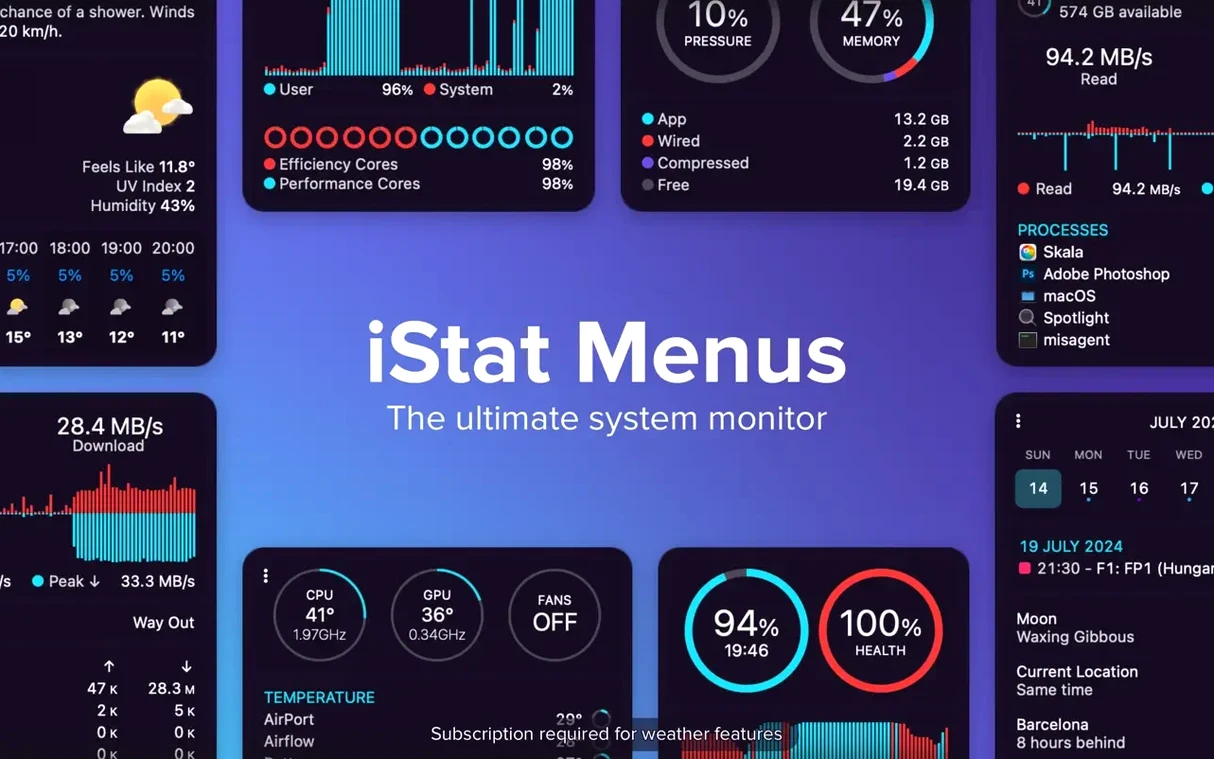
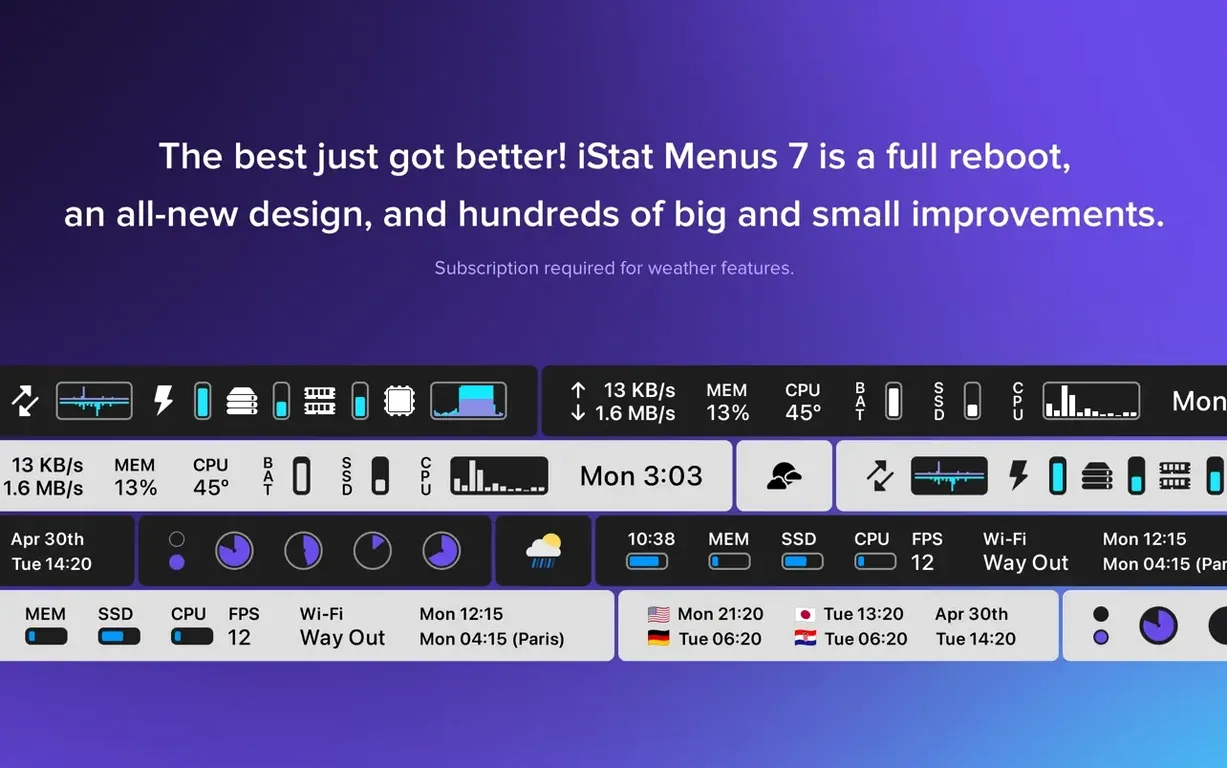
macOS buries its vital signs inside Activity Monitor, a separate window you have to deliberately open. The moment you close it, the data is gone. That gap means memory pressure can creep up, a process can silently pin a core, or a runaway upload can saturate your connection without any visible sign until the machine slows down. iStat Menus puts those numbers back in your peripheral vision, directly in the menu bar, where a glance tells you what is happening.
| Detail | Spec |
|---|---|
| Current version | 7.50 |
| macOS requirement | macOS 11 or later |
| Architecture | Apple silicon and Intel 64-bit |
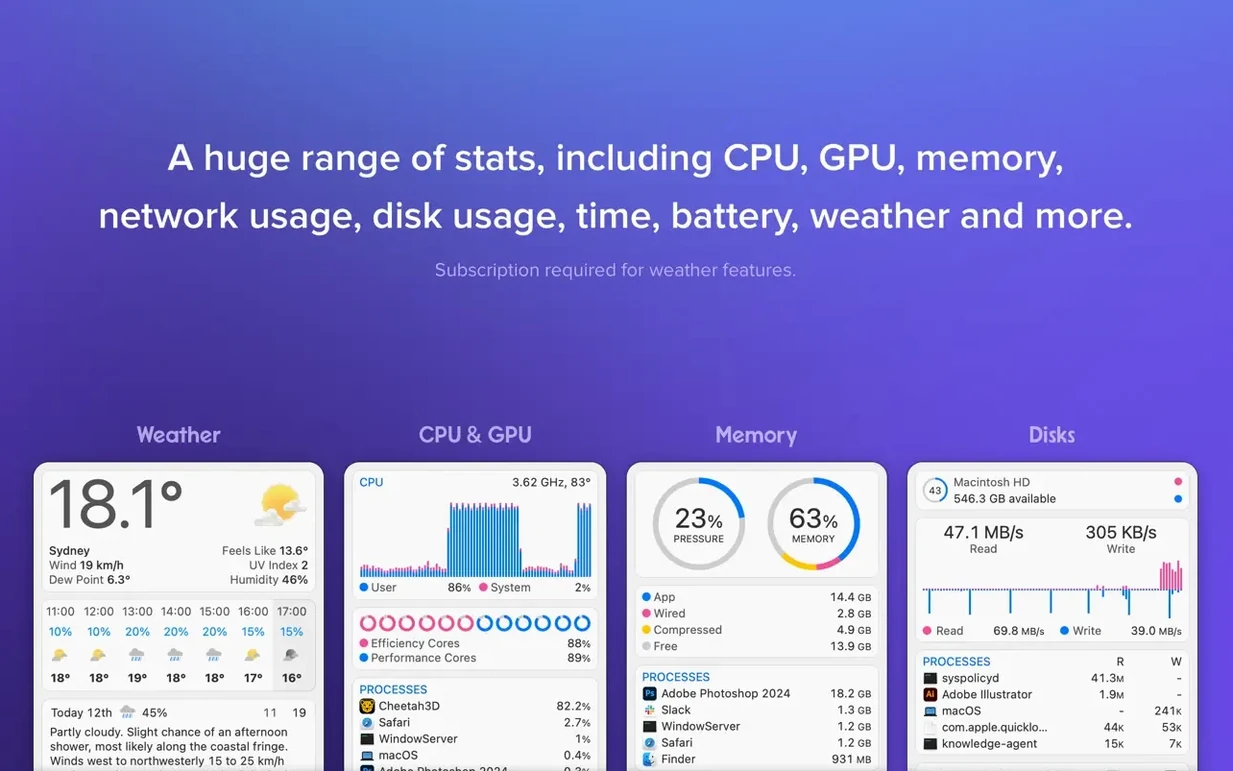
| Key areas monitored | CPU, GPU, memory, disks, network, sensors, battery, weather, time |
Tracking memory pressure is a good first task because it surfaces how the app works. Open iStat Menus and switch to the Memory tab. Tick the box to enable the menu bar item, then select the dropdown display style. From the graph options, choose a line chart over the default pie — a line shows the pressure trend over the last 20 seconds, which is more useful than a static slice. The same tab lets you add a second indicator for swap usage, so you can spot exactly when the Mac starts leaning on the SSD to compensate. Every module follows this same logic: pick a sensor, choose a compact visual, and set the update interval from the global preferences. Once configured, the menu bar becomes a live dashboard that reports 0.5 °C sensor deltas, real-time network throughput, and per-core CPU loads without a single click.
How iStat Menus fits into the macOS ecosystem
The menu bar is macOS territory that most apps leave alone. iStat Menus extends it, so understanding how it cooperates with other software and system services makes the difference between a cluttered strip of icons and a deliberate information panel.
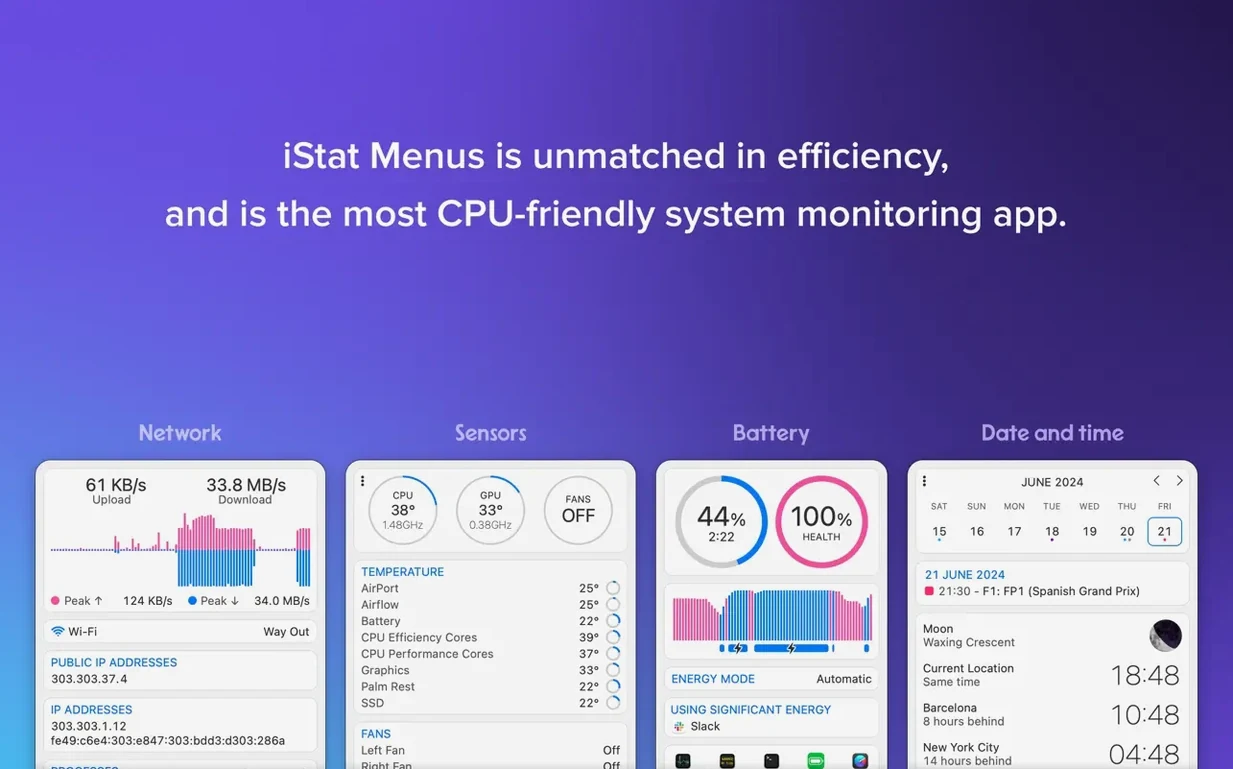
Network monitoring works alongside Little Snitch and Radio Silence without conflict — iStat Menus reads the same kernel-level counters those firewalls use, but it only displays throughput, never interferes with traffic. The per-app bandwidth breakdown under the network dropdown mirrors what Activity Monitor’s Network tab reports, though iStat Menus refreshes it in the menu bar every second instead of the default 5‑second window Apple uses. If you run a VPN client like WireGuard or the built-in IKEv2 connector, the interface labels update to show the tunnel name, so you can tell at a glance whether traffic is routing through utun4 or the physical en0 interface.
Disk activity indicators align with fs_usage data and the I/O counters in iostat. The S.M.A.R.T. status check polls drive controllers directly, flagging “Failing” when a threshold attribute trips — the same raw value that Disk Utility surfaces only after you dig into the Info panel. Battery health readouts pull from the same IOKit power source dictionary that pmset -g batt uses, so the wear level percentage and cycle count match what System Information reports under the Power section.
The weather module taps the same Apple Weather data source as the iOS widget, but macOS has no built-in weather panel, so iStat Menus fills that gap entirely. Time and world clock items coexist with the system clock — you can hide the default menu bar clock from System Settings and use the iStat Menus version instead, which adds a custom format string and a one-click calendar popover that the stock clock lacks.
Fan speed rules, exclusive to the direct-download variant, write to the SMC via the helper tool. That means they persist after sleep and do not get overridden by Apple’s thermal management unless the CPU die temperature exceeds the firmware safety curve — at that point the SMC asserts priority, which is correct behaviour and not a conflict.
Swap the 3‑Second Graph Lag for Instant Feedback
The factory defaults are sensible but generic. A few adjustments early on shape the whole experience.
Update frequency in global preferences. The default 3‑second interval conserves a tiny amount of CPU but makes graphs feel sluggish. Dropping it to 1 second costs roughly 0.1 % of one performance core on an M1 and makes line charts track load spikes accurately. If you monitor a server Mac Mini that sits headless, push it to 10 seconds — the menu bar is not visible anyway, and the dropdown graphs still show the full history buffer.
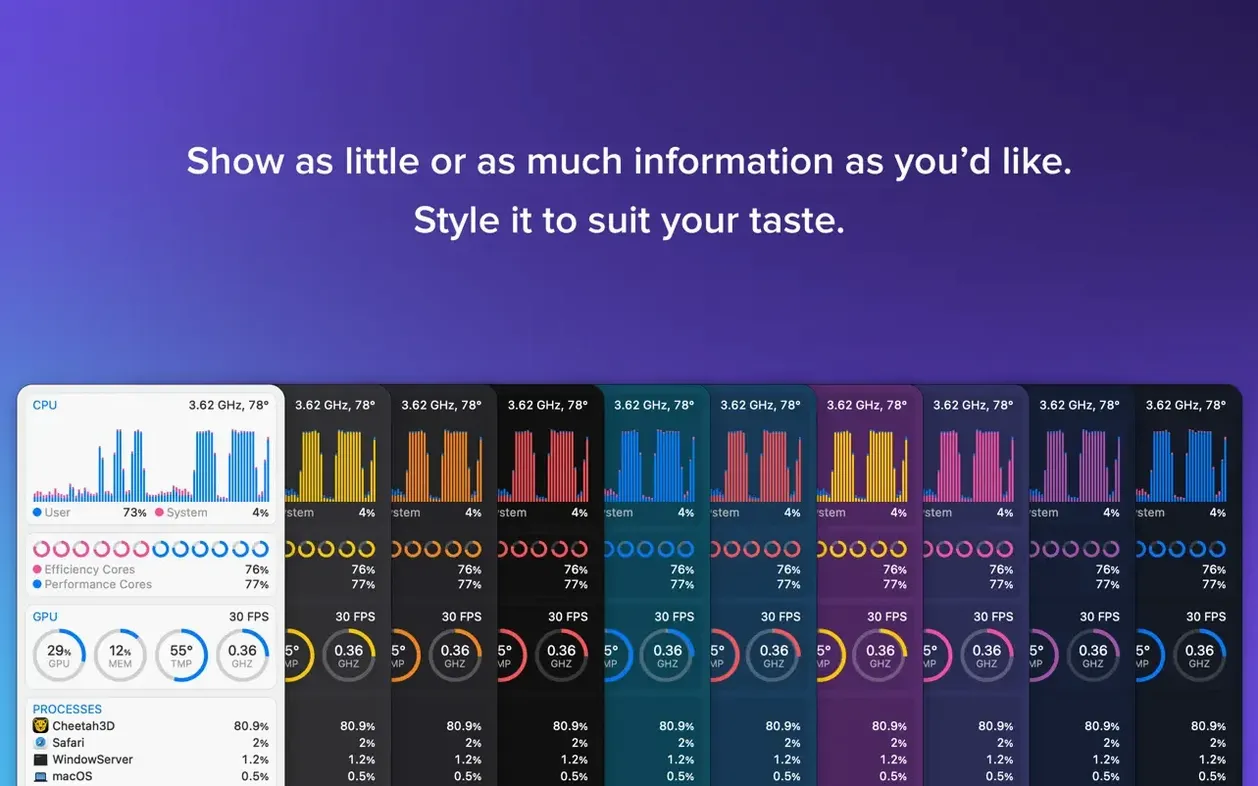
Hotkey for the combined dropdown. Under the global settings pane, assign a keyboard shortcut to “Open combined menu bar item.” Something like Control‑Option‑Space gives you a single panel that stacks CPU, memory, network, and disk stats without touching the mouse. This is the closest thing to a system dashboard overlay, and it works even when menu bar real estate is tight because the combined item occupies zero extra space until invoked.
History length per module. Each sensor section has its own graph history setting. The CPU history defaults to 1 hour, which is fine for spotting sustained loads, but memory pressure benefits from 24 hours — a slow leak that chews 50 MB per hour is invisible on a short window. Disk I/O graphs are most useful at the 1‑minute range, where a burst from a backup job or a Spotlight index rebuild stands out as a spike.
Notification thresholds. The temperature module can trigger alerts when a sensor crosses a limit you set. The default is off for everything. Pick the CPU proximity sensor and set 95 °C as a warning — on Apple silicon that is the point where the system begins aggressive throttling. Network notifications work well for cellular‑tethering scenarios: flag a warning when cellular data exceeds 200 MB in a session, which catches a runaway Photos sync before it eats the month’s allowance.
Double‑Click a Graph to Bypass the Preferences Trip
- Double‑click a graph to open the module’s full panel. A single click opens the dropdown, but a double‑click on any menu bar graph jumps straight to the iStat Menus preferences pane for that module. It saves the trip through the dock icon or the global menu.
- Command‑drag to reorder menu bar items. Holding Command and dragging any iStat Menus icon lets you reposition it relative to other Apple and third‑party menu bar icons. The order persists across reboots.
- Middle‑click on the time item to open a world clock map. If you have the time module active with world clocks configured, a middle‑click (or a three‑finger tap on a trackpad) shows a small map with daylight shading and pin dots for each city. The feature is undocumented and only present in version 7.50.
- Option‑click any menu bar item to show raw sensor IDs. Useful when cross‑referencing with Terminal tools like
powermetrics— instead of matching by label guesswork, you get the exact IORegistry key name. - Pin a dropdown open. Click and drag downward from the menu bar icon, release at the bottom edge of the dropdown, and the panel detaches as a floating HUD window that stays visible while you work in another app. It auto‑updates at the set refresh rate.
- Custom date format tokens. The time module supports
strftime‑style tokens in its format field, not just the preset selections. Entering%a %d %b %H:%Myields “Thu 13 Mar 14:22” — finer control than the dropdown picker offers.
From Café Wi‑Fi to Killer RAM Hog in One Session
A designer arrives at a café, opens the MacBook, and connects to the venue’s Wi‑Fi. The iStat Menus network item in the menu bar reads 0 KB/s ↓ 0 KB/s ↑, then flicks to 12 KB/s ↓ 2 KB/s ↑ as Mail and Messages sync. The upload spike tells her the connection is working; the menu bar icon turns from grey to black the moment throughput crosses the 1 KB/s threshold she set in the display options.
She launches Lightroom. The CPU graph in the menu bar — a compact set of eight core‑load bars, each a 4‑pixel‑wide strip — jumps from idle to three cores at 70‑80 %. The combined dropdown, opened with Control‑Option‑Space, confirms the GPU is also active: the GPU frequency line ticks up to 1296 MHz, something the macOS Activity Monitor would not show at all on
- Astronomy item — new menu bar module added.
- Observing forecasts — seeing, transparency, cloud cover, and other conditions now available.
- macOS 11 or later
- Apple silicon or Intel 64-bit Mac
Questions on file
What sensors can iStat Menus report?
It reads temperatures, fan speeds, voltage, current, and power draw from the Mac's internal sensors, as well as battery health and charge cycles for portables.
What does version 7.50 add?
Version 7.50 introduces an Astronomy item with observing condition forecasts including seeing, transparency, and cloud cover.
Sign in · Create an account to add a field note.
No field notes yet. A measurement, a version, a machine — they appear after moderation.