Mac Apps
iStatistica Pro 7.1.3
Mac AppsUpdated
| Requirement | On file |
|---|---|
| macOS | OS X 10.11 or later |
| CPU | Apple Silicon, Intel 64-bit |
| Download | 20 MB |
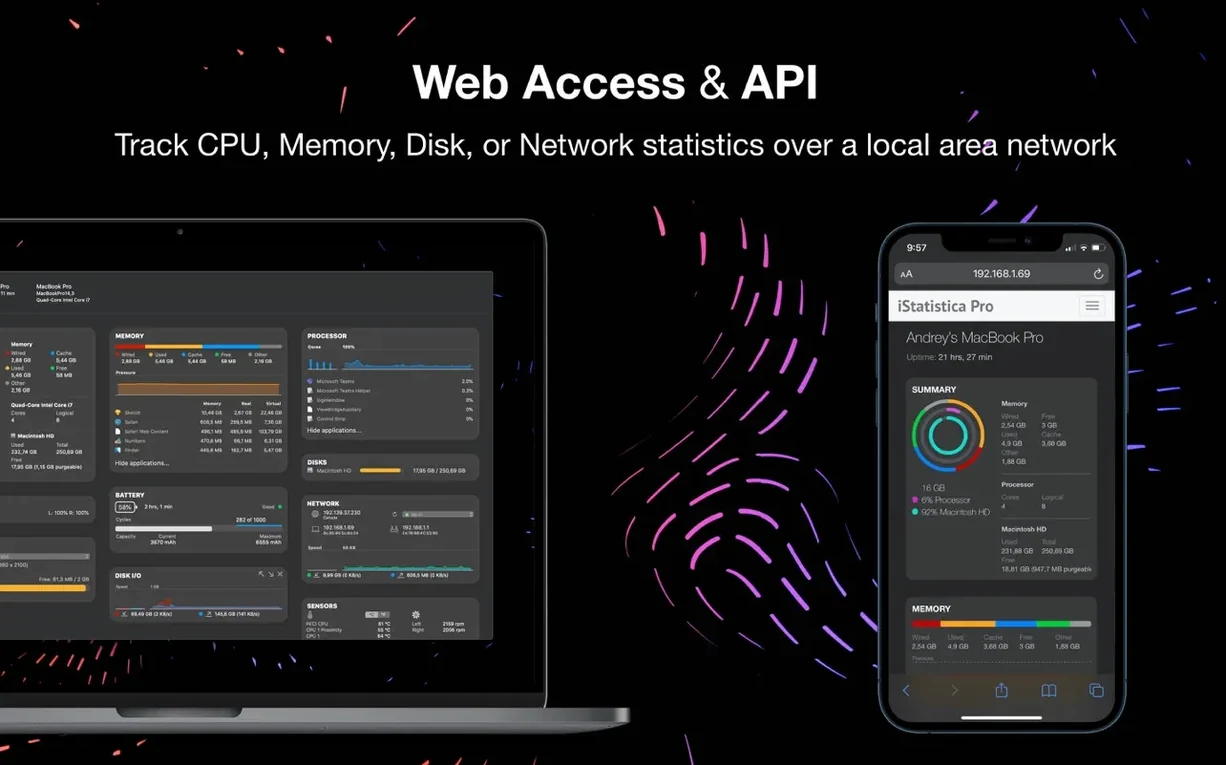
The web access panel doesn't just mirror the desktop interface; it streams live sensor data to any device on the local network. That feature alone defines what the tool is good for: keeping an eye on a headless Mac Mini or a server tucked away in a cupboard, without needing a screen attached.
Native Apple Silicon Profiler for M-series Macs
It runs on any Mac with OS X 10.11 or later, and the binary is universal — Intel and Apple Silicon are both supported natively. The version 7.1.3 update added a dedicated Apple Silicon Profiler, so M1/M2/M3 Macs get correct per-core sensor mapping out of the box.
What hardware can it actually read?
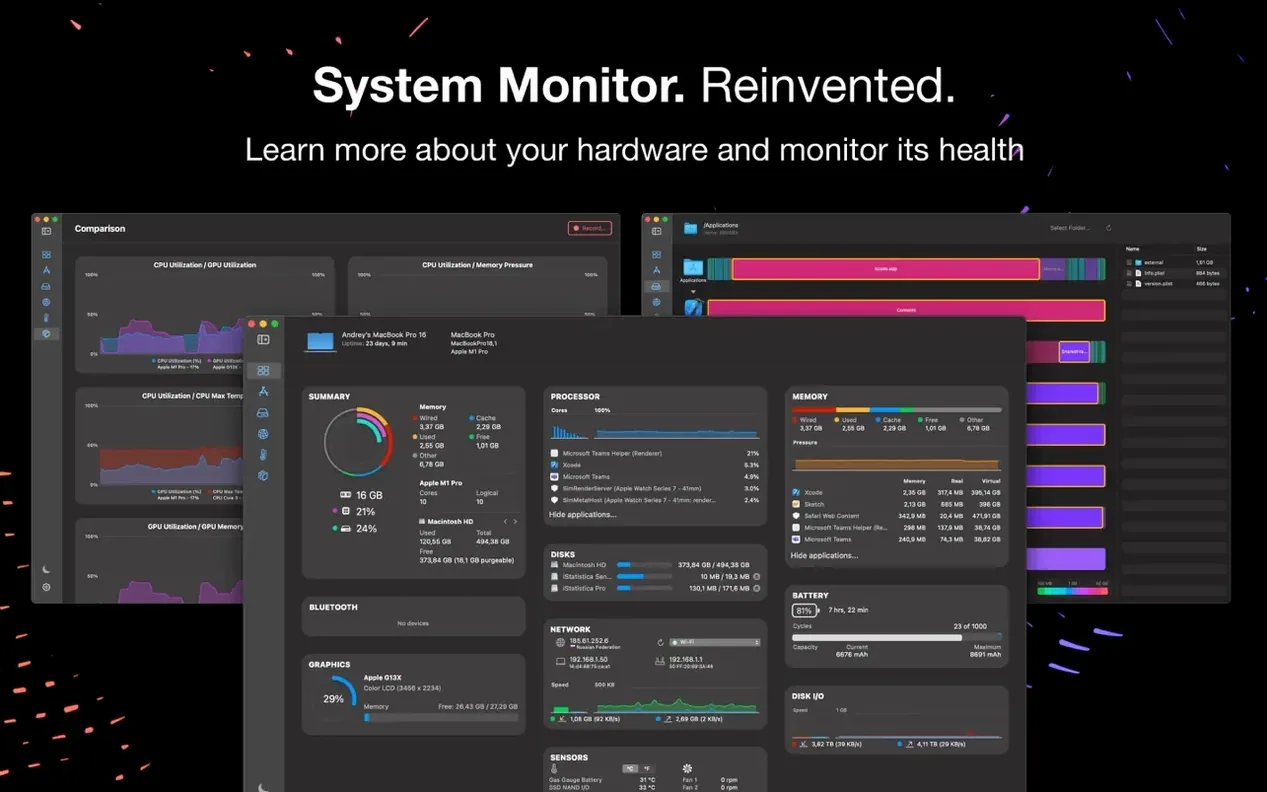
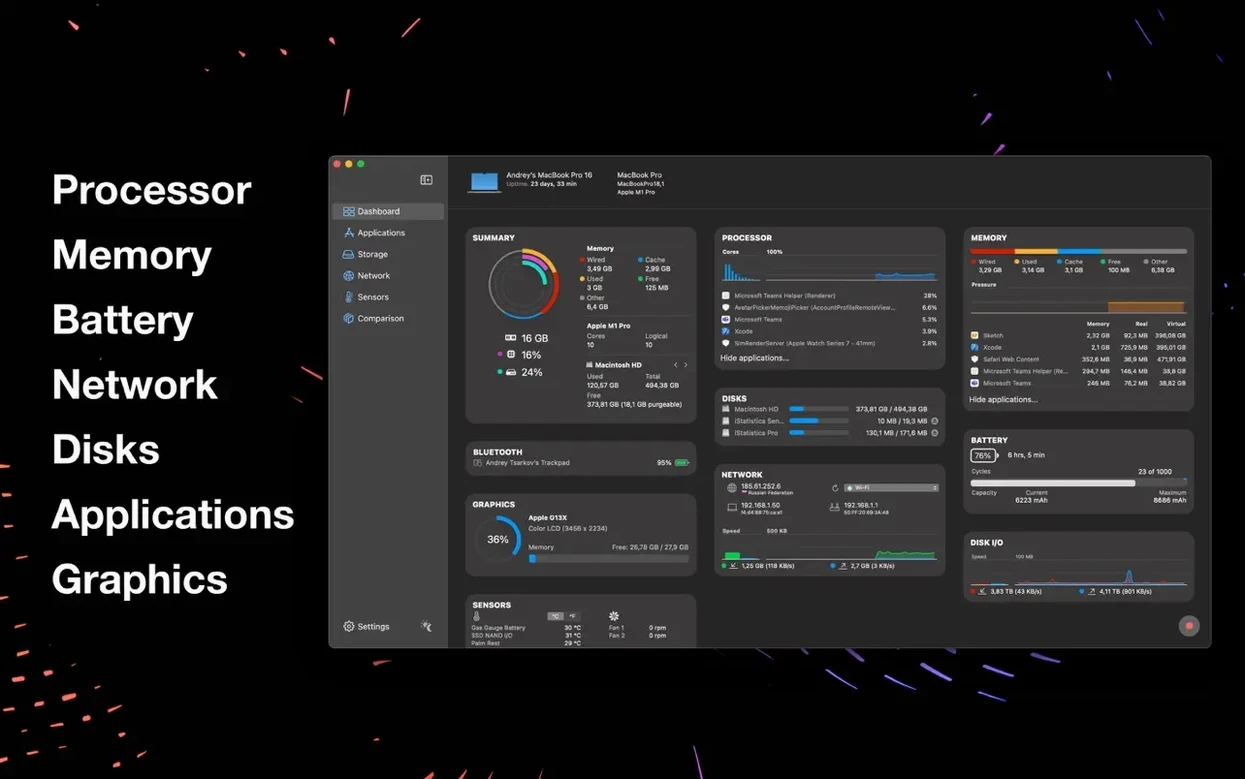
The sensor list covers CPU temperature, fan speeds, battery cycle count, health percentage and full charge capacity. Disk usage is shown per volume, and network interfaces get their own control panel with real-time speed and data rate charts.
What does the web access give me?
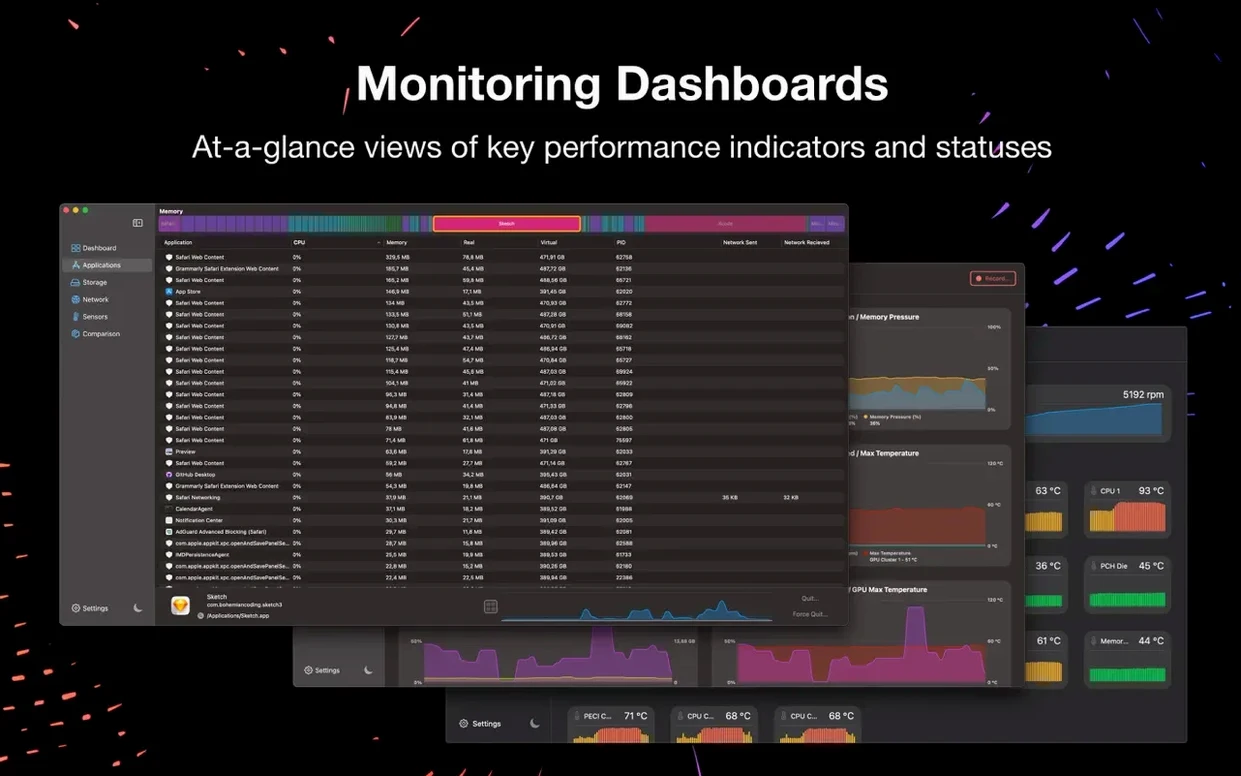
Once enabled, it provides a lightweight browser dashboard for CPU, memory, disk and sensor statistics accessible from any device on the LAN. No agent install needed — just the IP and port.
What's missing from the data?
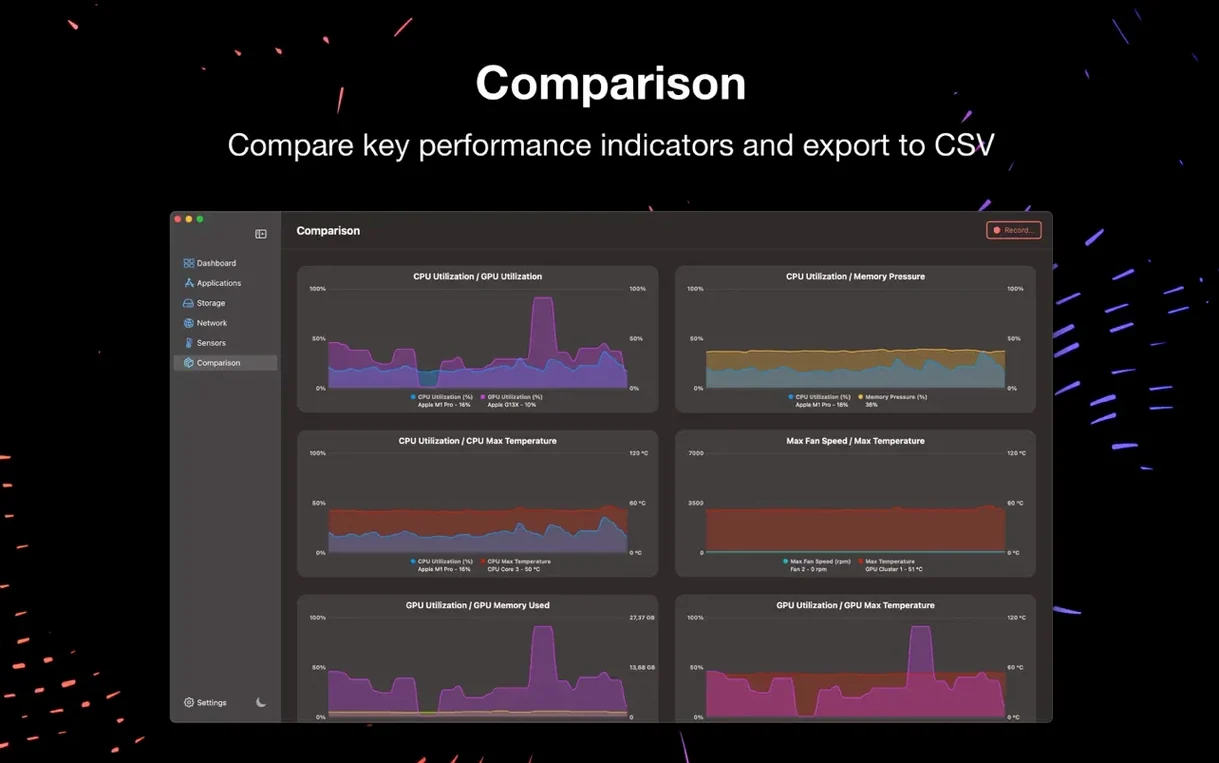
GPU metrics don't appear in the interface, and the CPU history chart shows combined load rather than per-E-core and per-P-core breakdown on Apple Silicon. Fan control is read-only; you can't set curves from here.
One machine, two tasks — a video editor's afternoon
Picture a freelance editor working on a Mac Studio. A 12‑minute project is rendering in DaVinci Resolve, saturating all P-cores for the next 40 minutes. Meanwhile the editor starts organising B‑roll on a MacBook Air in the next room. The Studio's screen is off, but iStatistica Pro's web dashboard is open on the Air — port 3333, no extra software. The editor glances at CPU temperature holding at 87°C and memory pressure in the yellow, decides the render is fine, and gets on with sorting footage. Once the render completes, the dashboard confirms the E‑cores have dropped back to idle, and the fan has spun down from 2800 rpm to 1200. That kind of lightweight remote awareness turns a cupboard‑bound machine into something you can still practically use.
Feeding sensor data to widgets, not replacing Activity Monitor
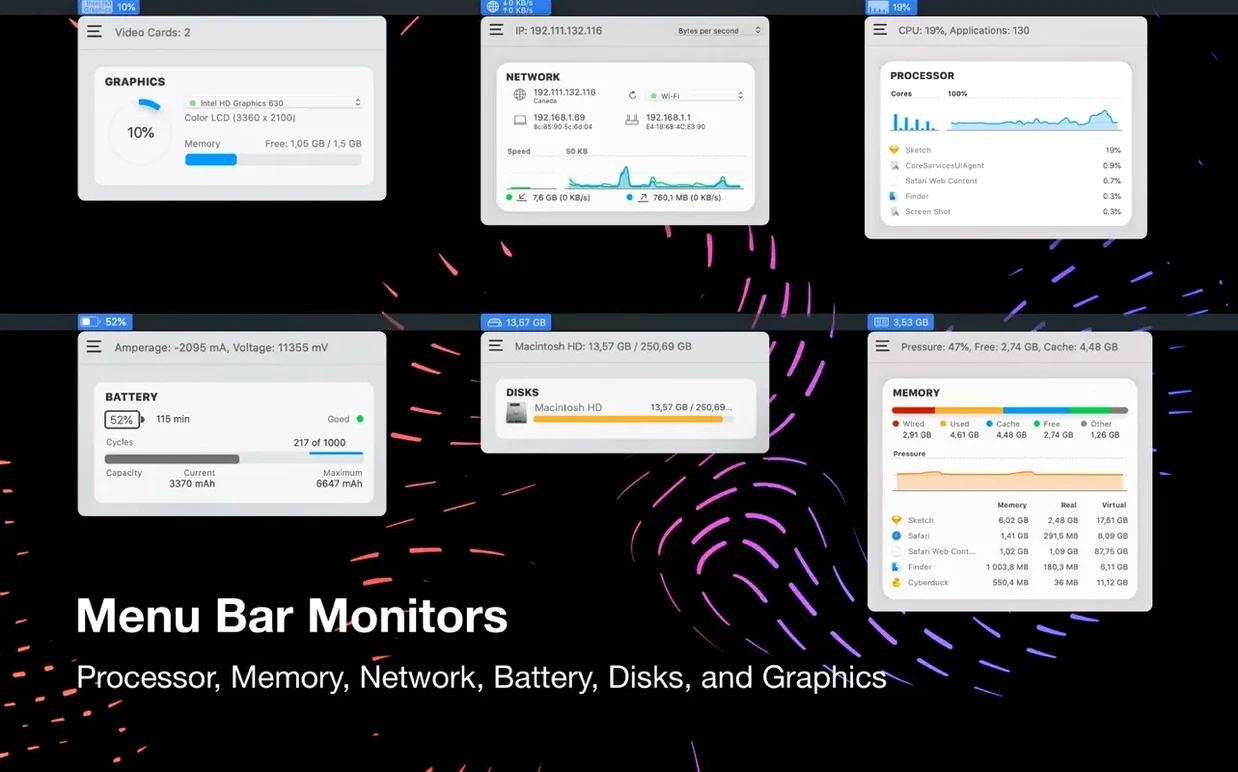
iStatistica Pro makes most sense when it's feeding data to other apps, not trying to replace them. The menu bar widget sits alongside Activity Monitor's Dock icon, but each serves different reflexes: Activity Monitor for killing a runaway process, iStatistica for tracking what happened in the previous 30 minutes via its CPU and memory history charts.
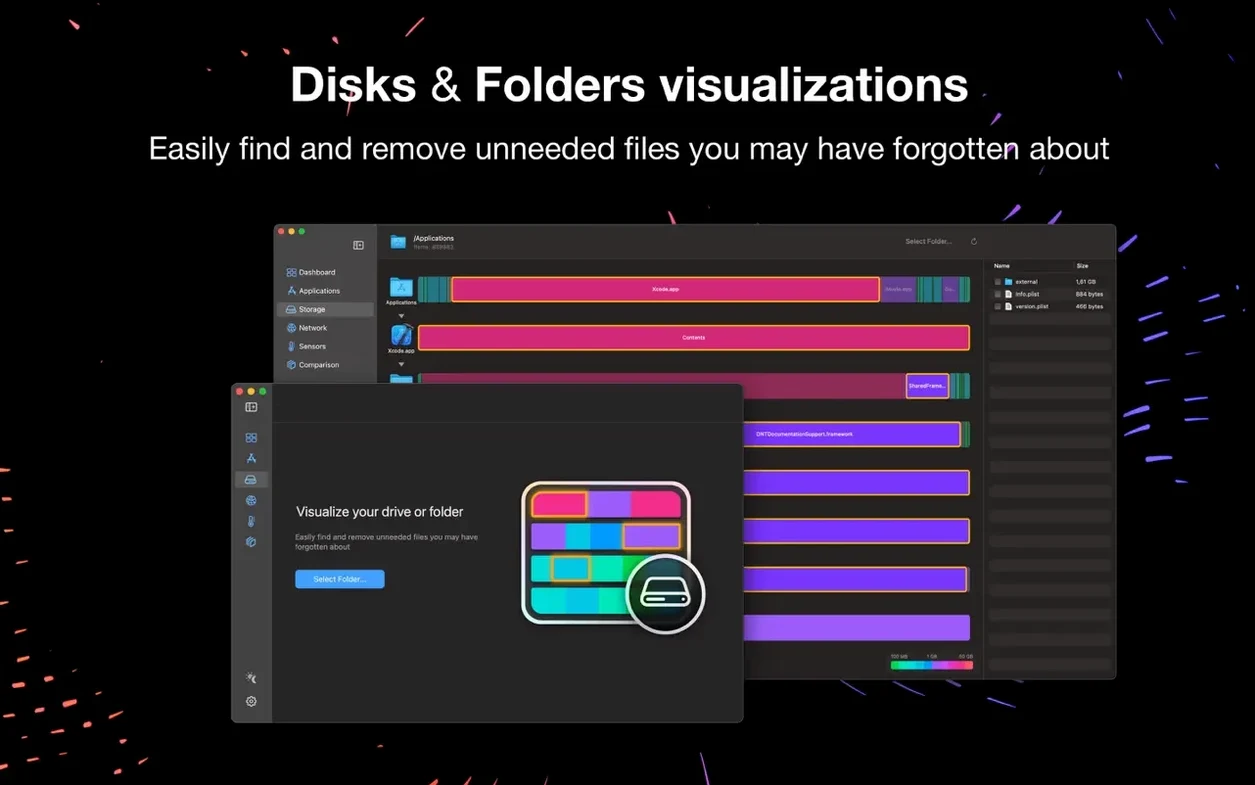
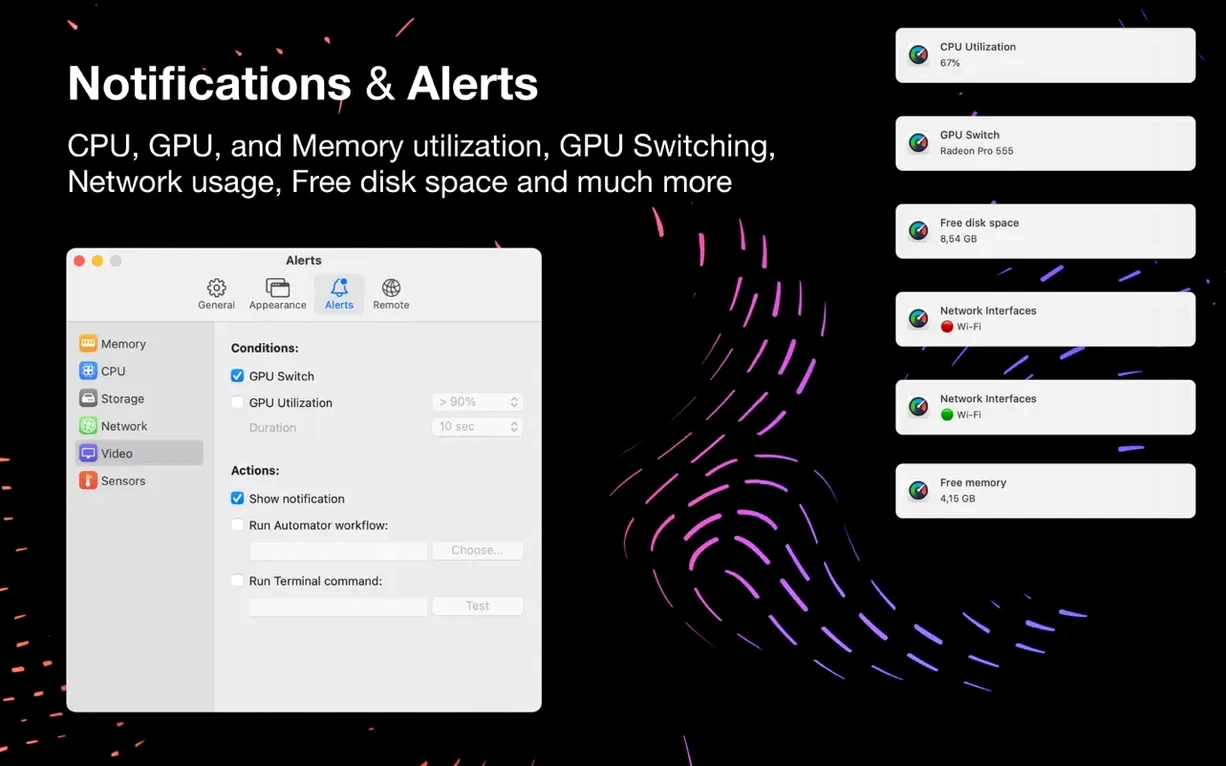
The network control panel gives per‑interface data that complements Little Snitch's connection‑level detail. You can watch a Wi‑Fi transfer peaking at 680 Mbps while Little Snitch tells you which process is pushing the bytes. With macOS's built‑in Shortcuts, you can trigger a notification when the battery health readout changes — nothing fancy, just a shell script scraping the web dashboard JSON. The folder visualisation module doubles as a lightweight DaisyDisk companion: it won't replace DaisyDisk's depth, but it's fast for spotting a stray 40 GB cache folder before you fire up the heavier tool.
How three system monitors compare
iStat Menus is the closest competitor and the more granular tool. It covers GPU frequency, per‑core CPU graphs, and custom fan curves for supported Macs — all missing from iStatistica Pro. But iStat Menus has no built‑in web dashboard, so remote monitoring requires third‑party workarounds. If the primary need is a LAN‑accessible sensor feed, iStatistica Pro does it out of the box while iStat Menus stays screen‑bound.
Stats (open source) is lean, free, and reads most of the same sensors — CPU, memory, network, battery, temperatures. The difference is polish and extras. Stats lacks the folder visualisation, the drive‑space treemap, and the web access module entirely. It's a solid menu bar monitor for a single machine; it doesn't stretch to a second room.
Sensei overlaps on storage visualisation and drive health, and adds SSD trim detail and SMART attribute decoding that iStatistica Pro doesn't attempt. But Sensei loads more like a dashboard utility with cleanup features; it doesn't expose a web server, and its CPU/memory monitoring is secondary to its disk focus. The two apps can coexist — iStatistica Pro for always‑on monitoring, Sensei for the quarterly SSD health check.
The common thread: if you need a menu bar monitor and a LAN dashboard and a quick storage treemap in one package, the feature overlap is rare. If you need only one of those, the alternatives are stronger in each narrow lane. The istatistica pro mac full version landing page makes it clear that the web module is the differentiator — the rest is solid but matched elsewhere.
- Apple Silicon Profiler — added native per-core sensor mapping for M-series chips
- Compatibility — resolved issues on recent macOS builds
- OS X 10.11 or later
- Intel or Apple Silicon Mac
Sign in · Create an account to add a field note.
No field notes yet. A measurement, a version, a machine — they appear after moderation.