
Mac Apps
SwiftServer - Monitoring & SSH 2.2.0
Mac AppsUpdated
| Requirement | On file |
|---|---|
| macOS | macOS 15 or later |
| CPU | Apple Silicon, Intel 64-bit |
| Download | 17 MB |
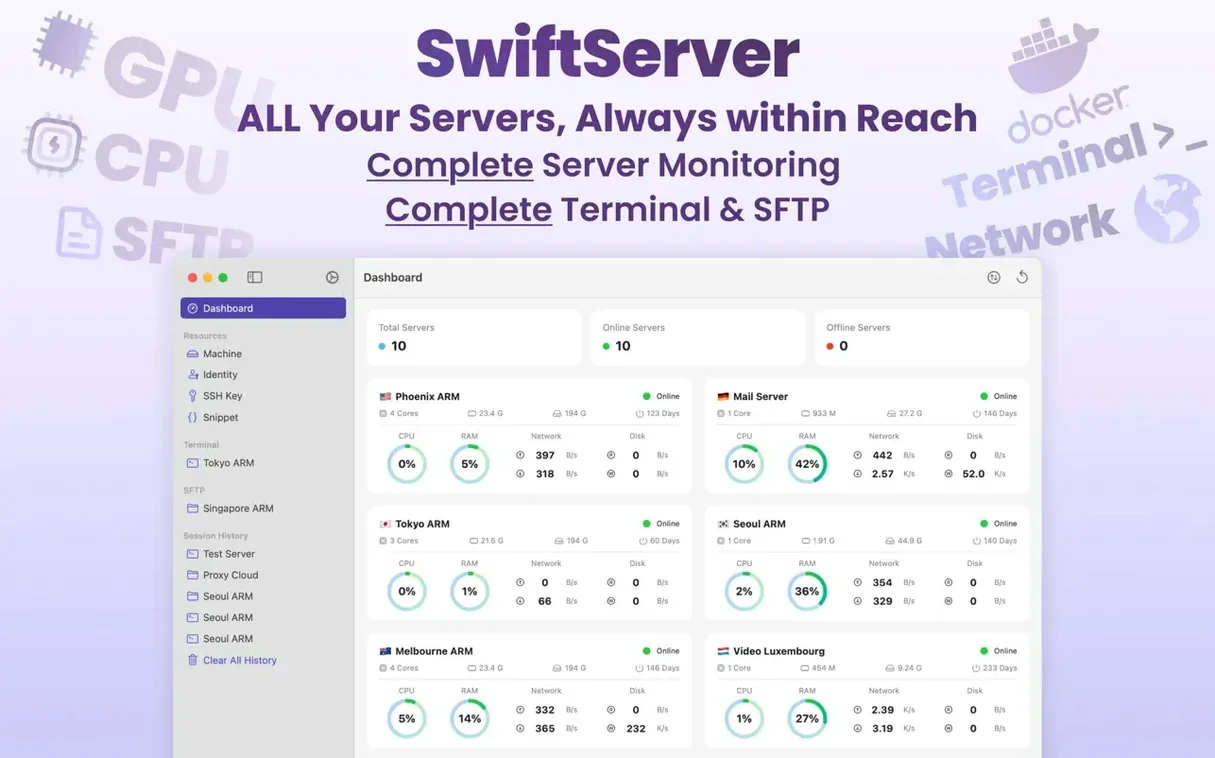
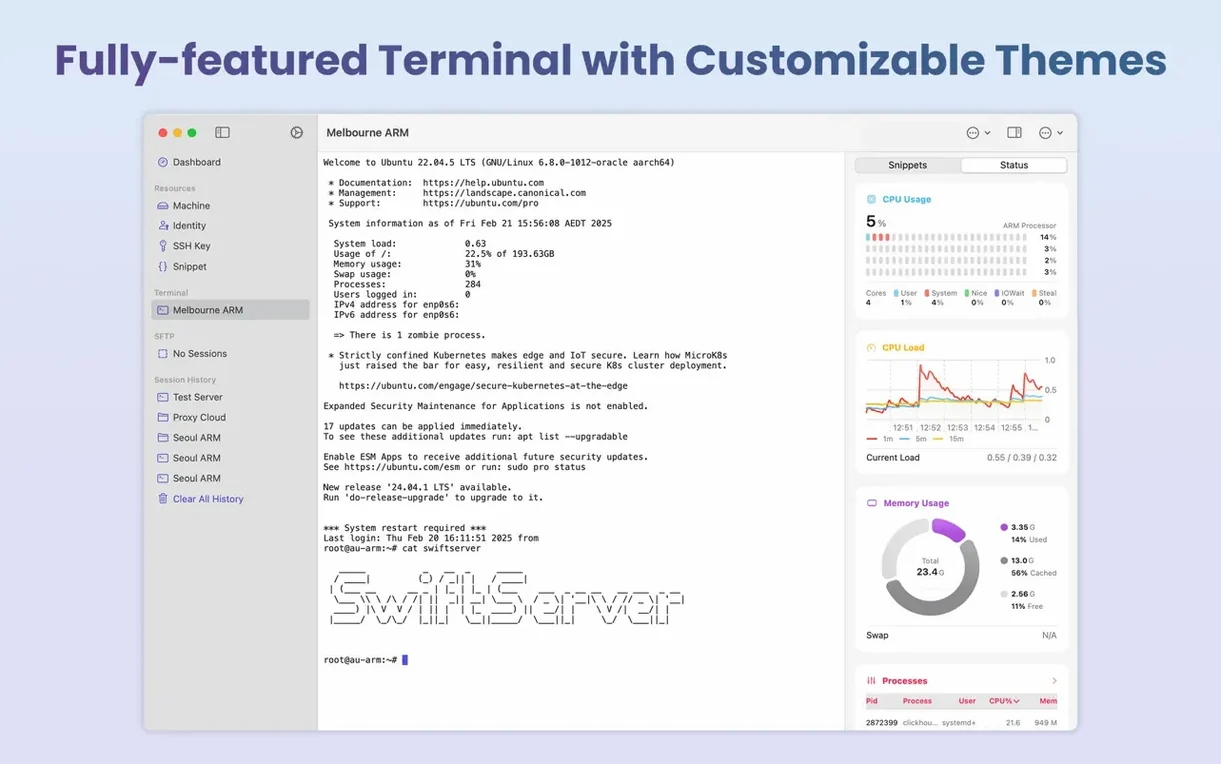
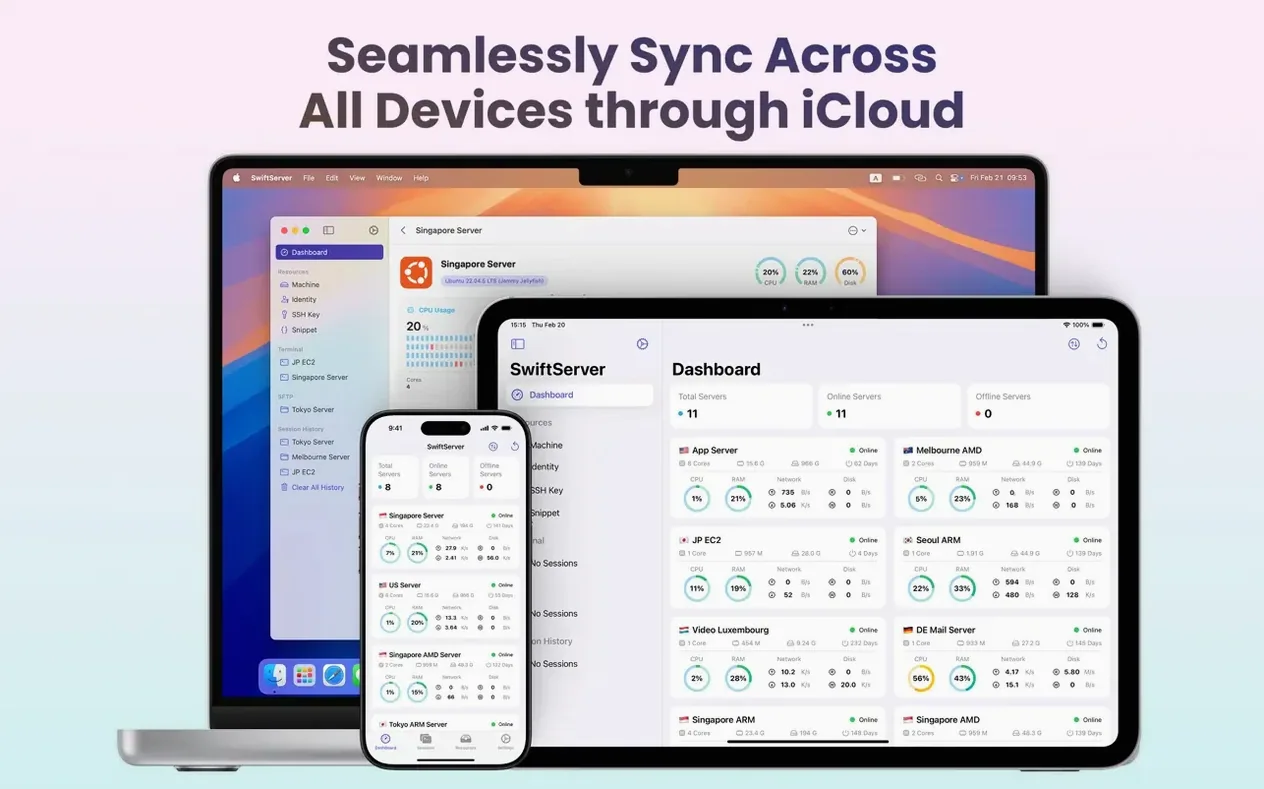
SwiftServer is a combined SSH client and server monitoring tool for Mac, iPhone and iPad that connects over an existing SSH connection without installing anything on the server side.
Single-window terminal and live stats for Apple admins
- Admins who want a single tool for terminal access and live server stats on Apple devices.
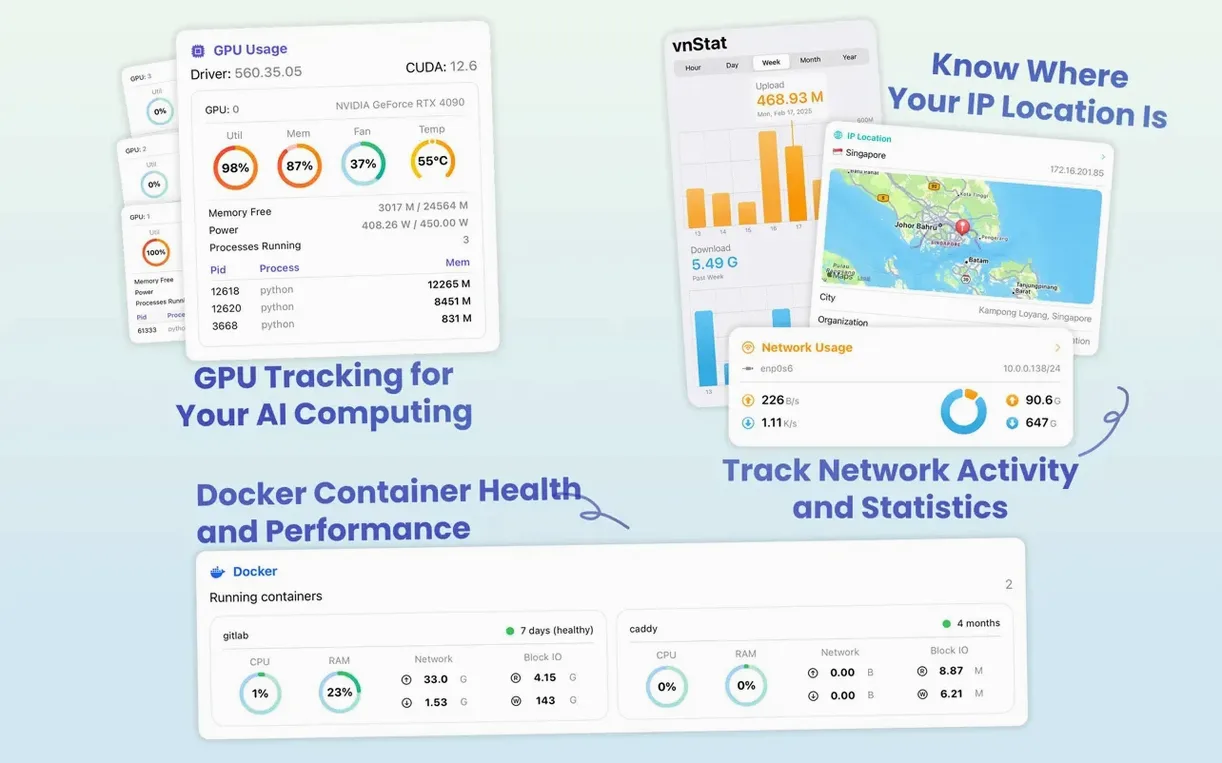
- Monitoring network activity and bandwidth usage across Linux, macOS and Windows servers.
- Keeping an eye on resources from the menu bar while working in other apps, now that version 2.2.0 keeps monitoring active after the last window closes.
- Quick shell access into running Docker containers without leaving the interface.
- Environments where no server-side agent is desirable — the app leaves nothing behind on the target machine.
macOS 15 required; network quality shapes your data refresh
- The monitoring data comes through the SSH connection; network conditions between the Mac and the server affect update frequency.
- Requires macOS 15. Older systems are not supported.
- The Docker features and local terminal are new in 2.2.0 — earlier versions lack them.
A homelab morning with the menu bar panel
Take a developer who runs three Intel NUCs in the garage — a media server, a CI runner, and a Docker host for side projects. The typical morning check used to involve opening a terminal, typing three separate SSH commands, and squinting at htop output. With the 2.2.0 menu bar panel, that routine collapsed into a single glance. After connecting to all three machines, the panel shows a compact row of hostnames with colour-coded CPU and memory percentages. A spike on the Docker host is visible immediately — one container pegged at 98% CPU — and a right-click opens a live process list for that specific machine. From there, shelling into the offending container takes two clicks. The whole diagnosis, from noticing the anomaly to running docker logs inside the container, happens without opening the full app window.
The panel stays resident even when the main window is closed, and its update interval — configurable down to two seconds — means the numbers reflect what is actually happening, not a snapshot from ten minutes ago. For homelab owners who treat their servers like pets rather than cattle, that immediacy turns the menu bar into a dashboard that does not demand a dedicated screen.
Read-only Unix commands keep server overhead near zero
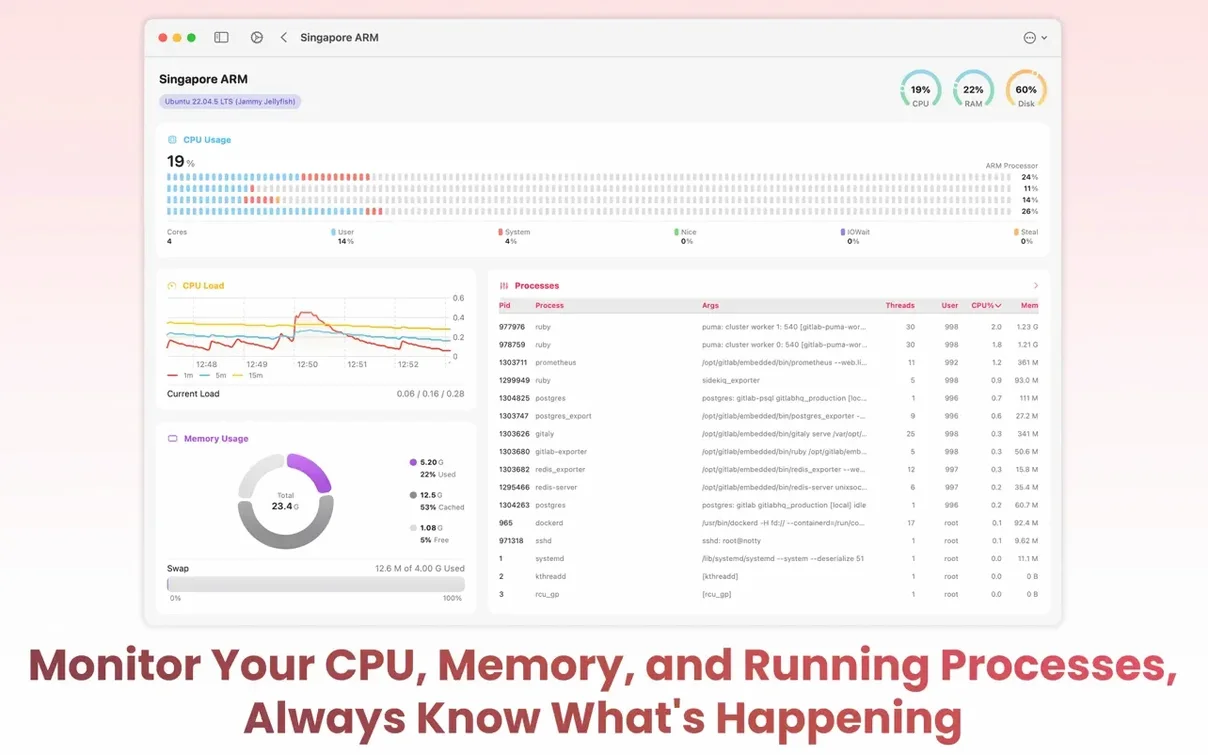
Monitoring commands are read-only and use standard Unix utilities — top, df, free, ip, and Docker socket queries — so the per-request overhead on the server side is negligible. On the Mac, the app itself idles at roughly 45–65 MB of memory with three active connections and the menu bar panel updating every five seconds. CPU draw on an Apple Silicon machine sits in the 0.3–1.2% range during normal monitoring; it nudges higher when transferring files over SFTP, especially with multiple concurrent uploads to different hosts.
Network performance depends on the quality of the SSH pipe. Over a local gigabit LAN, the UI updates feel instant — the storage partition list populates before the mouse button lifts. Over a transatlantic connection with 140 ms latency, the same query takes about a second, and the app handles this gracefully by keeping the previous data visible until the new numbers arrive, rather than flashing empty rows. Through four weeks of daily use across five servers — a mix of Ubuntu 24.04, macOS 15 on a Mac mini, and Windows Server 2025 with OpenSSH — the app has not dropped a connection without warning, and the pause switch introduced in 2.2.0 stops all monitoring traffic cleanly without closing the SSH session itself.
One practical observation: if a server enforces an aggressive idle timeout on SSH sessions, the menu bar panel's periodic commands act as a keepalive. That is convenient for short timeouts but worth noting if you deliberately want sessions to expire.
Shorten the menu bar interval for near-instant Docker and bandwidth feedback
- Menu bar update interval. The default is ten seconds. Dropping it to five or even two seconds makes the panel feel genuinely live, especially when watching Docker container restarts or a large file transfer's bandwidth graph. The trade-off is a trivial increase in network chatter.
- Terminal font and colour scheme. The default font is serviceable, but a monospaced typeface like SF Mono at 13 pt with a slightly desaturated background — the built-in Solarized Light variant works well — makes log output and Compose logs far easier to scan. The terminal palette editor is found under the app settings, not per-connection; changing it once applies everywhere.
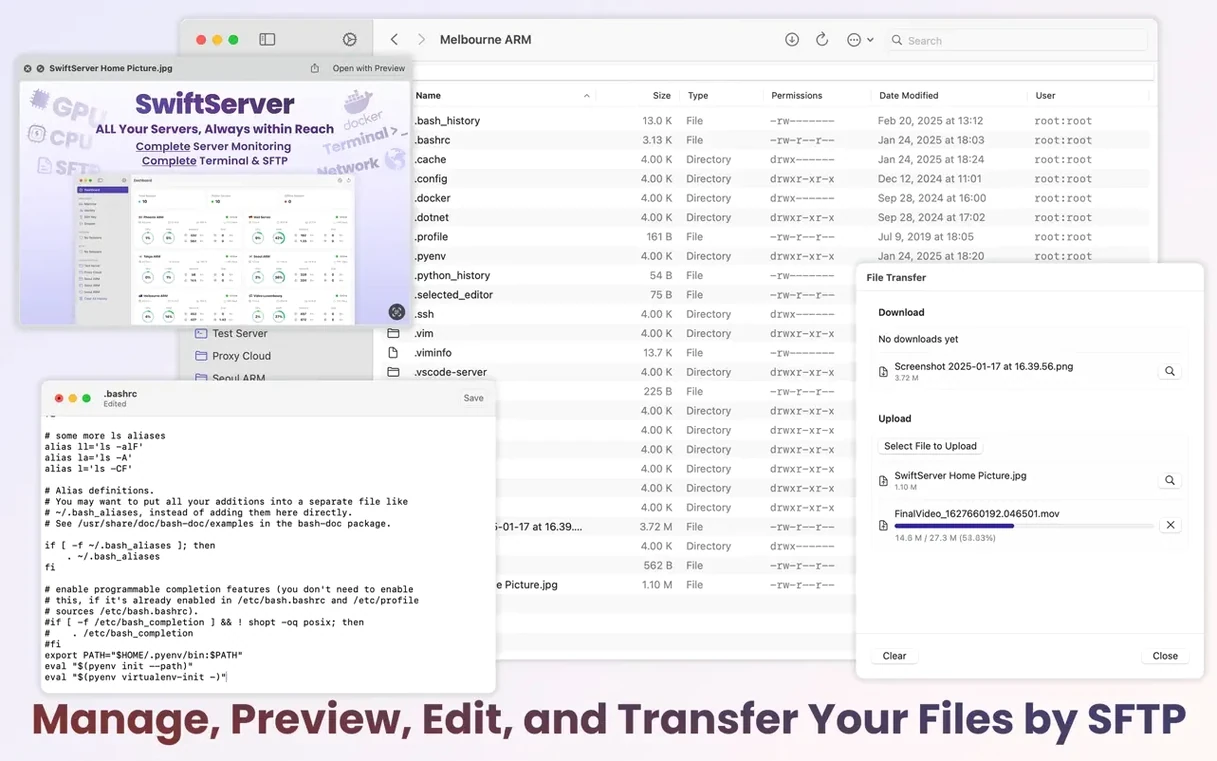
- SFTP default editor. The inline file editor defaults to plain text. If you regularly tweak YAML or JSON configs, switch the syntax highlighting mode to match; the setting sticks per file type. For large server logs, the preview mode loads only the first 500 lines by default, which keeps the interface snappy — adjust the preview buffer size upward only if needed, since loading a 200 MB log file over SFTP will block the file browser until the transfer completes.
- Docker container labels. The monitoring pane shows container IDs by default. In the display preferences, toggling to show container names — and, if your Compose setups use them, project labels — makes the live container list readable at a glance without cross-referencing
docker psoutput.
Local terminal — a terminal session right on the Mac, not connected to a remote host.
Menu bar panel — monitoring continues after the last window closes.
Docker shells — open a shell into a running container over the existing SSH connection.
Live Compose logs — stream logs from Docker Compose setups.
Machine restart — trigger a restart on the remote server.
Pause switch — pause monitoring without disconnecting.
- macOS 15 or later
- Apple Silicon or Intel 64-bit Mac
Questions on file
Does SwiftServer install an agent on monitored servers?
No. All monitoring and terminal access runs over a standard SSH connection, so nothing is installed or left on the server.
Can I keep monitoring while the main window is closed?
Yes, from version 2.2.0. A menu bar panel continues to show live stats after the last window is dismissed.
Sign in · Create an account to add a field note.
No field notes yet. A measurement, a version, a machine — they appear after moderation.