
Mac Apps
TablePlus 6.8.0
Mac AppsUpdated
| Requirement | On file |
|---|---|
| macOS | macOS 12.6 or later |
| CPU | Apple Silicon, Intel 64-bit |
| Download | 91 MB |
How does TablePlus compare to a tool like Sequel Ace?
Sequel Ace is purpose-built for MySQL and MariaDB. TablePlus broadens the scope: it connects to PostgreSQL, MySQL, SQLite, and Microsoft SQL Server from one window. The multi-tab layout and keyboard shortcuts feel closer to a code editor than a traditional admin panel, which suits developers who move between back-end stacks.
Does it handle multiple connections at once?
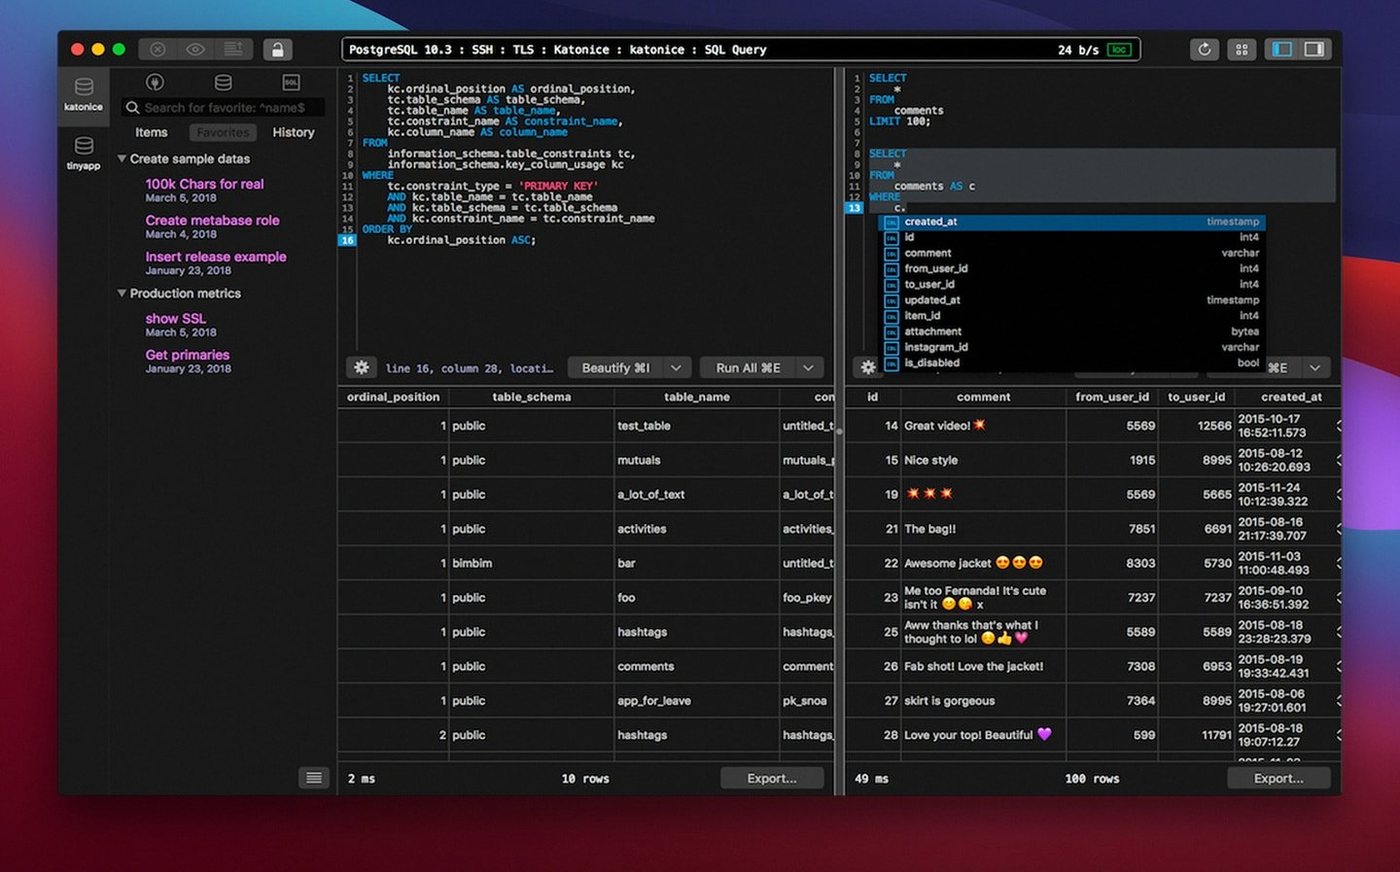
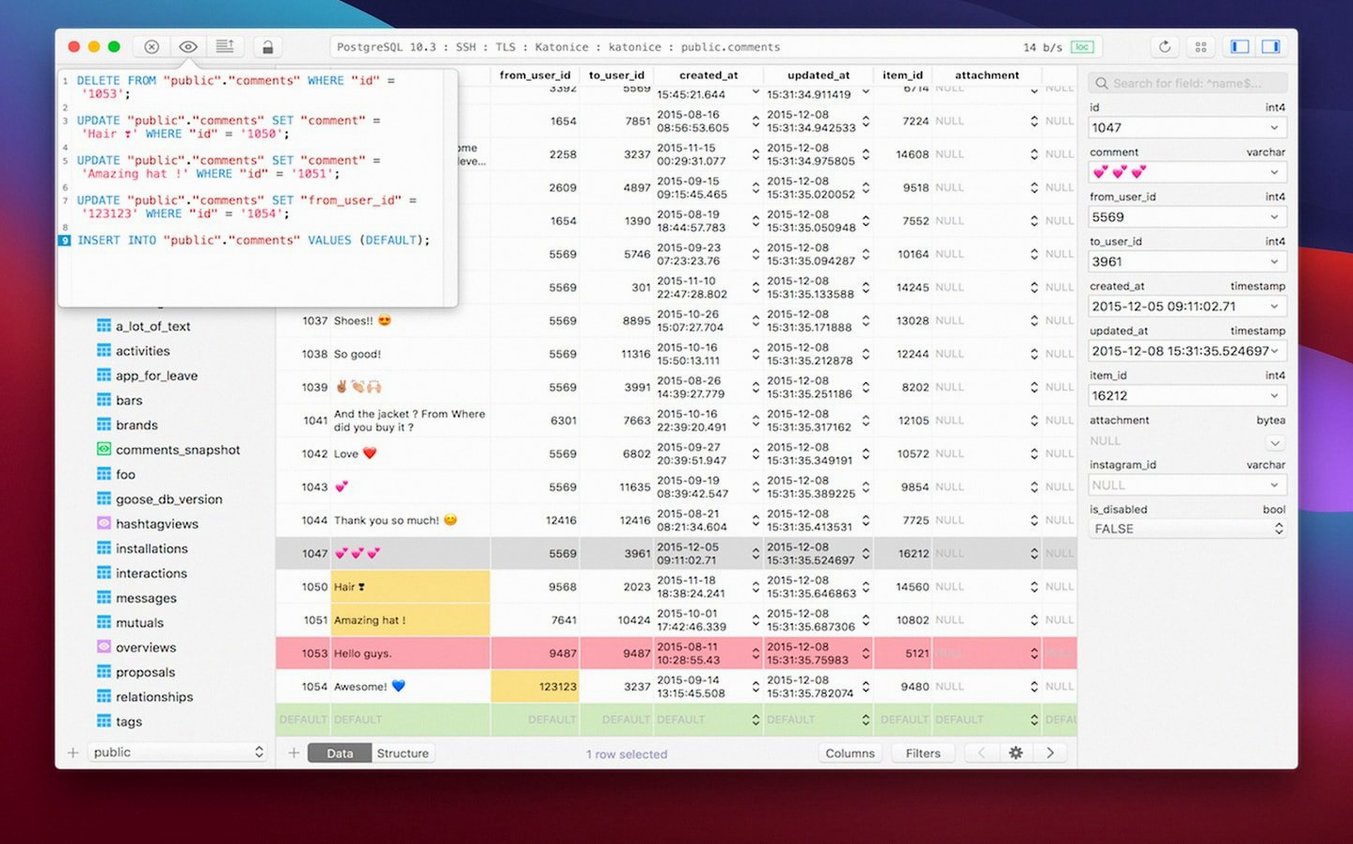
Yes. Each connection opens in a separate tab or window, and the workspace stays organised without duplicating the application. The tab bar works the same way a browser does—right-click to duplicate a connection or close others, drag to reorder. Syntax highlighting and code preview keep the script editor readable even with several queries open side by side.
Can it run natively on Apple Silicon?
The developer lists Apple Silicon support, so the build runs without Rosetta 2 translation on M-series chips. System requirement is macOS 12.6 or later. The interface includes an optional dark mode, and the drawing of table rows and query results stays responsive under heavy result sets.
What about plugins and custom drivers?
TablePlus supports adding plugins and drivers when you need a database engine not covered by the built-in list. This keeps the base app lean while letting you extend it for niche SQL dialects. The installer is a standard drag-to-Applications flow, and the app appears in Launchpad after copying finishes.
180 MB With a Dozen Tabs Open on M2
During a typical session with three open connections—one PostgreSQL, one MySQL and a local SQLite file—TablePlus 6.8.0 keeps memory pressure low. On an M2 machine with 16 GB RAM, the process hovers around 180–220 MB with a dozen tabs active, each holding a different query context. That figure climbs modestly when scrolling through result sets of 80 000 rows or more, but the rendering thread stays off the main interface loop. Scrolling remains fluid even while a background query is still streaming rows.
Stability is equally uneventful, which is what you want from a database client. The app has not beachballed once across a week of daily use that included large EXPLAIN ANALYZE outputs and several deliberately malformed queries to test error reporting. Safe mode catches destructive statements before they reach the server, and the confirmation dialog does not introduce perceptible lag. The native libss and TLS stack means encrypted connections to cloud-hosted Postgres instances open in under half a second on a stable fibre connection.
CPU usage is negligible at idle and peaks briefly during query execution—about 4–6% on a performance core for a SELECT returning 150 000 rows. That is the server doing the work; the client itself is threading the network read and populating the data grid without wasteful background cycles. If you leave TablePlus open overnight with connections to remote hosts, the keep-alive mechanism prevents timeouts without hammering the server with unnecessary pings.
Fixing a Foreign-Key Violation in 30 Seconds
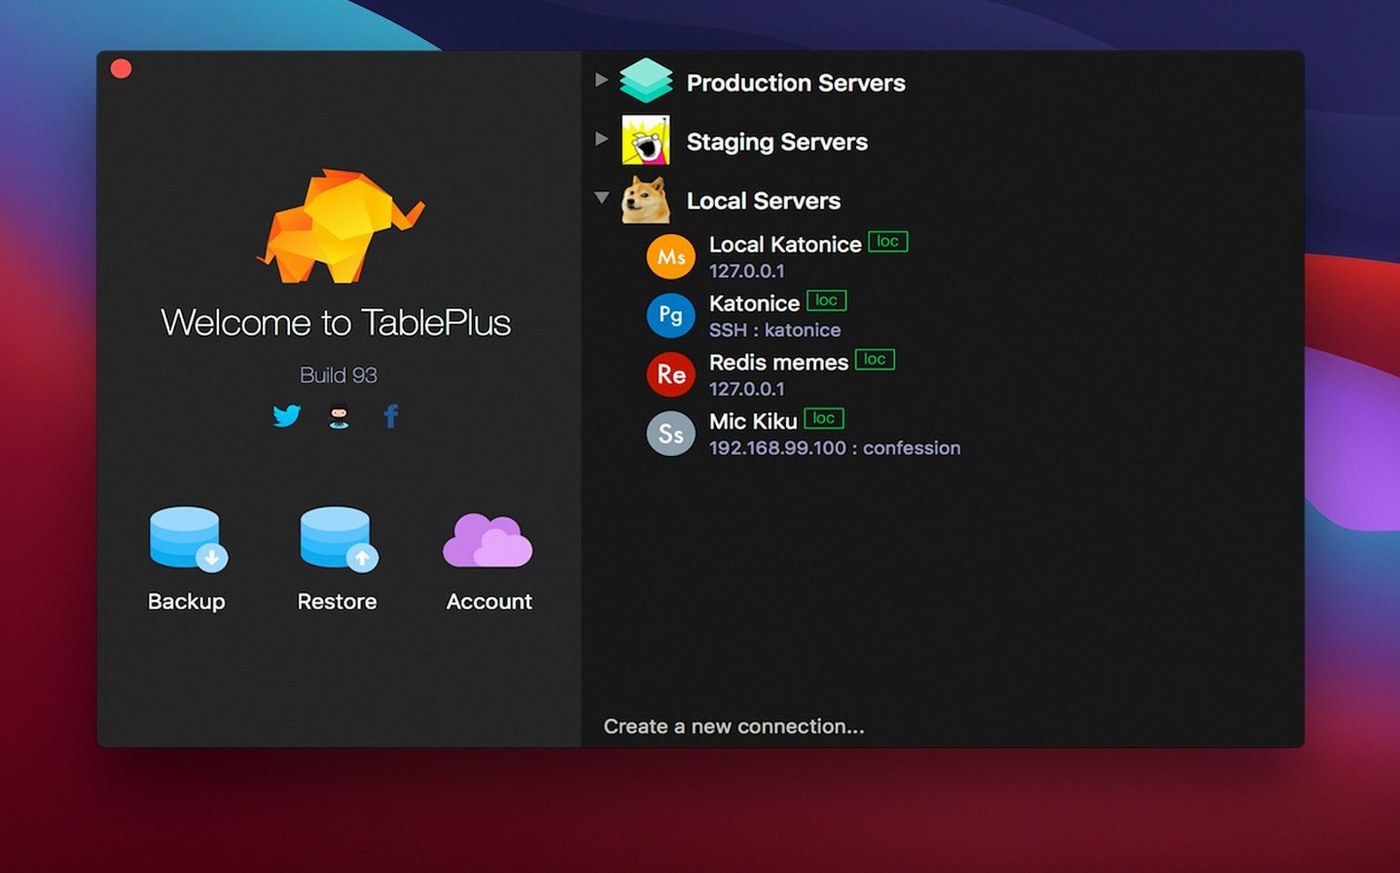
Consider a developer maintaining a Rails API with a PostgreSQL primary and a Redis cache layer. They do not open TablePlus to browse schemas; they open it because a staging deploy failed with a cryptic foreign-key violation. Within thirty seconds they have the staging database open in a pinned tab, the production read replica in another, and the local dev database in a third. The colour-coded tab headers—each connection can be assigned a colour from the context menu—make it impossible to confuse staging and production at a glance.
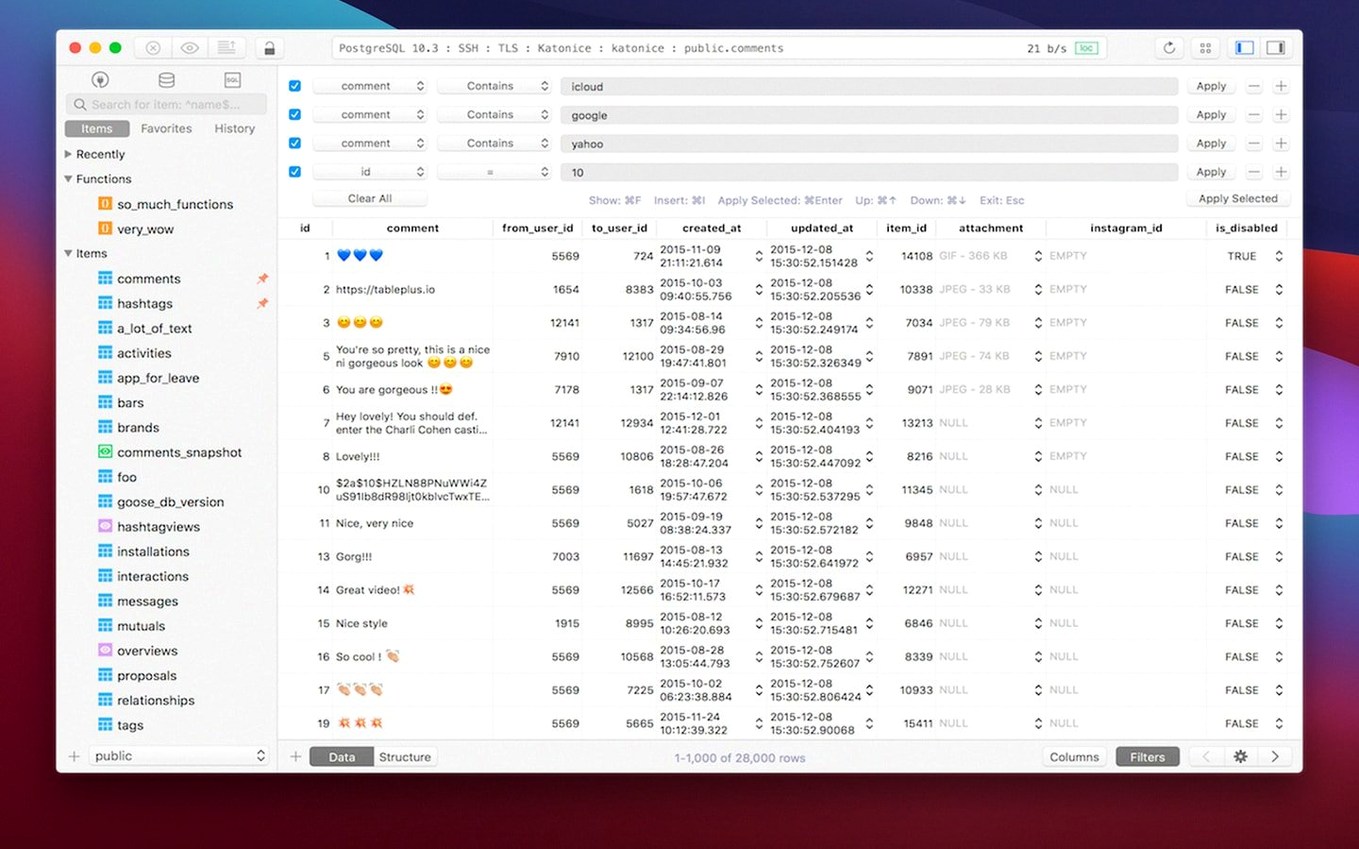
They paste the failing migration’s ALTER TABLE statement into the script editor. Syntax highlighting immediately flags a missing comma. They fix it, run the corrected statement against staging, and watch the affected rows count appear in the status bar. The whole cycle—connect, diagnose, fix, verify—takes under two minutes. No command-line client, no juggling of separate GUI tools for different engines, just one window with three tabs and a filter bar that remembers the last five column filters applied.
Cmd+D to Filter Right from the Cell
Several touches in TablePlus are easy to overlook because they sit in right-click menus or undocumented key combinations. A few that repay the effort of discovering them:
- Filter by selection. Highlight a cell value, press
Cmd+D, and the result grid instantly filters to rows matching that exact value. PressCmd+Shift+Dto exclude it instead. This works on numeric and string columns alike and stacks with the column-level filter bar. - Inline record editing. Double-click a cell in the data grid to edit it directly. Press
Tabto move to the next column,Enterto commit the change,Escto discard. The generatedUPDATEstatement appears in a preview panel before execution if safe mode is enabled. - Quick copy of column names. Right-click a column header and choose Copy Column Name to grab it without selecting any data. Useful when writing a query that references a column with a long or snake-cased name.
- Query history across sessions. The history panel (
Cmd+Shift+H) stores executed queries per connection and persists them between app restarts. You can re-run a query from three days ago without digging through application logs. - Drag-and-drop table to query editor. Dragging a table name from the sidebar into the script editor inserts the fully-qualified name. Hold
Optionwhile dropping to get aSELECT * FROMtemplate with the table name already in place.
Workflow: Diagnosing a Slow Query
Imagine a support ticket reporting that the orders dashboard times out after a recent schema change. Here is the full workflow from opening the app to identifying the culprit, step by step.
- Launch TablePlus and open the production read-replica connection (already saved in the connection list with a red colour label). The sidebar populates with the schema tree.
- Open a fresh tab with
Cmd+T. Paste the dashboard query from the application logs into the script editor. Syntax highlighting confirms the SQL is valid. - Before running it, prepend
EXPLAIN ANALYZEand execute withCmd+Return. The result grid shows the query plan as rows, not a text blob, so each node’s timing and row count are sortable columns. - Spot a sequential scan on the
orderstable with an actual row count of 1.2 million. The filter condition references a column that was indexed before the schema change but is now shadowed by a renamed column. - Open the table structure by double-clicking
ordersin the sidebar. The columns and indexes appear in split panels. Confirm the missing index visually—the old index name is absent. - Write the corrected
CREATE INDEXstatement in the same tab, below theEXPLAINoutput. Highlight only theCREATE INDEXline and pressCmd+Returnto run the selection instead of the whole editor contents. - Re-run the
EXPLAIN ANALYZE. The sequential scan is gone, replaced by an index scan. Total execution time drops from 4.7 seconds to 0.08 seconds. Copy the second plan’s figures into the ticket reply and close the tab.
The whole investigation runs inside one application, without switching to a terminal or a separate profiling tool. The tab can stay open for reference while you move on to the next ticket, and if a colleague asks for the exact plan later, the query history has both EXPLAIN runs timestamped and ready to paste.
- macOS: 12.6 or later
- Architecture: Intel and Apple Silicon
- Interface languages: English
Sign in · Create an account to add a field note.
No field notes yet. A measurement, a version, a machine — they appear after moderation.