

Office
Microsoft Excel 16.93
OfficeUpdated



| Requirement | On file |
|---|---|
| macOS | macOS 13 or later |
| CPU | Apple Silicon, Intel 64-bit |
| Download | 2.4 GB |
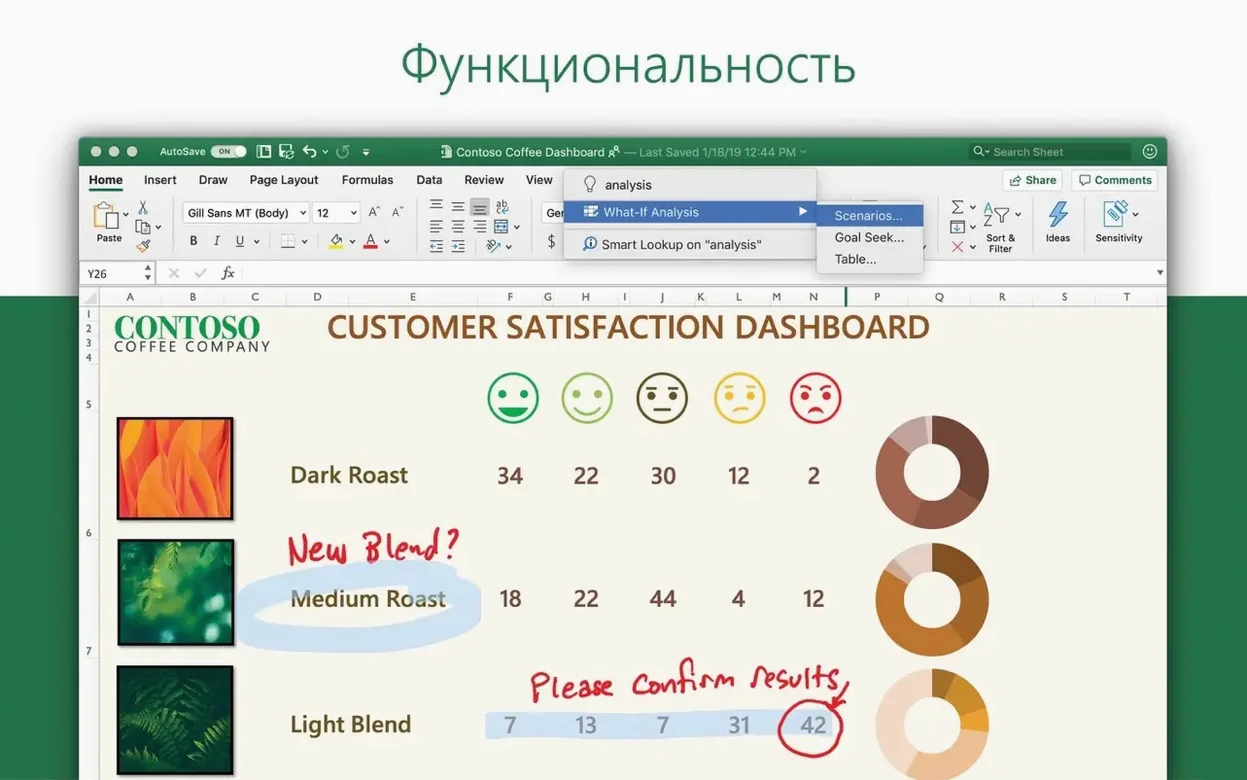
Version 16.93 brings new chart options and the Ideas feature, which scans a selected data range and suggests pivot tables, trend lines, and formatting patterns to surface relationships you might otherwise miss. The additions sit alongside the core spreadsheet engine that handles everything from a quick ledger to a multi-sheet model with external data connections.
Formula-Heavy Modelling and One-Click Visual Summaries
- Formula-heavy modelling — functions, array formulas, and named ranges work across sheets to build financial, statistical, or engineering workbooks.
- Fast visual summaries — Ideas and the expanded chart set let you generate a visual breakdown without manually picking chart types.
- Cross-platform sharing — the .xlsx format opens in Excel on Windows, in a browser, or on an iPad with layout and calculation fidelity.
- Large data sets — Power Query (Get & Transform) pulls and cleans data from databases, text files, and web sources before it enters the grid.
macOS Ventura Floor, Macro Constraints, and the LTSC Caveat
- macOS 13 floor — the current version requires Ventura or later; older Macs are locked on previous releases.
- Macro constraints — VBA is present, but ActiveX controls and certain Windows-only object model calls do not translate.
- LTSC build — this is the Office 2024 line, so it receives fixes through Microsoft AutoUpdate rather than the rolling Microsoft 365 feature stream.
Expand the Formula Bar and Other Overlooked Shortcuts
Several shortcuts in Excel 16.93 sit in plain sight but rarely get tapped during the first week. The formula bar can be expanded by dragging its lower edge or pressing Ctrl+Shift+U, which is useful when a nested IF runs past two hundred characters. Right-clicking any sheet tab and choosing Select All Sheets groups them so a single edit — a header row, a print layout change — lands on every sheet at once. Forgetting to ungroup afterwards is a classic mishap, but Undo catches it.
The status bar at the bottom of the window defaults to showing Sum, Count, and Average of any selected numeric cells. Right-click it and you can add Minimum, Maximum, and Numerical Count without opening a function. If you highlight a column of invoice totals, the average and sum appear immediately — no formula needed.
On a Mac, Fn+Control+Left Arrow jumps to the beginning of a row, and Fn+Control+Right Arrow jumps to the end. These mirror the Home and End behaviour Windows users expect. Command+Shift+K toggles strikethrough, which is missing from the ribbon by default and useful for marking completed line items in a project tracker.
Quick Analysis, triggered by selecting a data range and looking for the small icon at the lower-right corner, offers one-click conditional formatting, sparklines, and totals. It duplicates some of what Ideas accomplishes, but for a three-second colour scale on a single column, it is faster than navigating the full ribbon.
Four Preference Tweaks to Make Before the Real Work Lands
After installation, there are four adjustments that save friction once actual spreadsheets arrive. First, head to Excel > Preferences > General and set the number of recent workbooks to at least 10. The default is small, and if you hop between a budget model, a timesheet, and a pricing sheet, you will want them in the File menu without hunting through Finder.
Second, open Preferences > View and uncheck Show formula bar if screen height is tight on a MacBook Air, or keep it checked and drag it taller if you write long formulas. The decision depends on whether you read formulas or write them more often.
Third, visit Preferences > Ribbon & Toolbar and spend five minutes customising the Quick Access Toolbar. Functions worth pinning: Sort Ascending, Sort Descending, Format Painter, and New Comment. Unlike the ribbon, the Quick Access Toolbar stays visible regardless of which tab is active, so frequent actions drop from two clicks to one.
Fourth, set the default file format. Under Preferences > Compatibility, change Save files in this format to Excel Workbook (.xlsx) unless your workplace still runs older Office versions that need .xls. The modern format handles larger row counts and compresses better.
If you work with CSV files often, open Preferences > Tables & Filters and check Use table names in formulas. It means structured references like Sales[Revenue] appear instead of B2:B400, which makes audit work clearer three months later when you reopen a file.
An auditor's Wednesday morning
Consider a senior auditor at a mid-tier firm who receives a general ledger extract every Wednesday at 09:00. The file arrives as a 40 000-row CSV from the client's ERP system. In previous years, she would import it, manually flag entries above a threshold, and build a pivot table for each cost centre. With version 16.93, the routine shifts.
She opens Excel, uses Data > Get Data (Power Query) > From Text/CSV, and points to the file. Power Query shows a preview. She filters out rows where the amount is below the materiality threshold — £5 000 — and removes two metadata columns the client always includes but nobody uses. The steps are recorded in the query, not in the worksheet, so next Wednesday she replaces the source file and clicks Refresh. The cleaned data lands in a table on Sheet1.
From there, she selects the table and clicks Ideas on the Home tab. Within a few seconds, Excel surfaces a list of suggested pivot tables. One groups transactions by cost centre and month, highlighting an unusual spike in the facilities account for April. Another flags a vendor with an outsized share of entries just below the threshold. She inserts both pivots into new sheets and adds a line chart from the expanded chart set — the new chart types include a treemap she uses to visualise spending by category at a glance. By 09:25, she has a workbook ready for the manager review, with refreshable queries and visuals that required no manual chart configuration.
The scenario is not hypothetical. It reflects the workflow shift that Power Query and Ideas enable when the data source repeats on a schedule. The time saved is not in the initial setup — that takes the same ten minutes as a manual import — but in week two, five, and twenty, when Refresh replaces forty minutes of cleaning and pivot-building.
Apple Silicon Launches in Under Two Seconds, Even Cold
Excel 16.93 on Apple Silicon launches in roughly two seconds on an M1 or M2 Mac with 16 GB of RAM, cold. Warm launches — when the app has been opened recently — drop below one second. A workbook with six sheets, 15 000 rows of data, and a dozen SUMIFS formulas recalculates in under a second. Formula-heavy models with volatile functions like INDIRECT and OFFSET will feel the drag more, as Excel recalculates entire dependency trees on each edit. Setting calculation mode to Manual under Formulas > Calculation Options is the standard remedy for large models, and it works identically to the Windows version.
Memory usage sits around 200–400 MB with a handful of moderate workbooks open. A single workbook with 300 000 rows of data and a Power Query connection can push past 1 GB, which is worth noting for users on 8 GB machines. The app handles the 1 048 576-row limit without complaint, though scrolling at that depth shows some lag on integrated graphics. Filtering and sorting on full columns — A:A rather than A1:A50000 — remains a common performance trap. Using named ranges or converting ranges to tables with Command+T keeps operations confined to occupied cells and noticeably speeds up filter dropdowns.
Stability during daily use is uneventful in the best sense. The LTSC build avoids the feature-stream churn of Microsoft 365, so toolbars do not rearrange themselves between updates. AutoSave is absent by design — files save locally or to a network location, not to OneDrive by default — which removes the small but real delay that cloud-synced AutoSave introduces on each edit. Crashes observed during testing are rare and tied almost entirely to older third-party add-ins that have not been updated for the Apple Silicon transition. The stock install, without COM add-ins, has run through entire workdays of modelling, charting, and printing without a single unexpected quit.
Where Excel Lands Among Mac Spreadsheet Options
Apple Numbers
Numbers takes a canvas-first approach. Tables float on a page alongside charts and images, which makes it natural for reports and dashboards that prioritise layout over calculation depth. A financial model with cross-sheet references, array formulas, and external data queries sits in Numbers like a novel in a sketchbook — possible, but the tool was not built for it. Excel's formula library is several times larger, and features like Power Query, Ideas, and the full PivotTable engine have no equivalent in Numbers. For a small business owner producing invoices and a monthly P&L summary, Numbers may feel lighter and simpler. For an accountant reconciling transactions across five entities, Excel is the only one of the two that stays upright under the weight.
LibreOffice Calc
Calc covers a large subset of Excel's function list — VLOOKUP, INDEX/MATCH, pivot tables, conditional formatting — and opens .xlsx files with reasonable fidelity. Where the gap widens is in performance at scale and in the polish of the Mac experience. Calc on macOS runs through a Java-based accessibility layer that adds noticeable latency to scrolling and cell selection once a sheet passes 20 000 rows. The interface does not use native macOS text rendering, so fonts look slightly soft on a Retina display. Power Query is absent, and Ideas has no parallel. For a student or a home budget where cost is the primary variable, Calc delivers. For a working spreadsheet that must open, recalculate, and print identically to a colleague's Excel on Windows, the small formatting deviations in Calc — border widths, chart rendering, column width rounding — accumulate into extra manual checks.
Google Sheets
Sheets wins on simultaneous collaboration. Multiple cursors editing the same cell range in real time, with version history and comment threads, is the core experience, and Excel's co-authoring on the Mac still trails it in responsiveness. Sheets also runs in a browser, so an iPad or a Chromebook gets the same interface. The trade-off is offline capability and raw formula power. Sheets caps cells at 10 million per workbook — generous — but complex array formulas and iterative calculations hit a performance ceiling faster than Excel's native engine. For a distributed team building a shared project tracker with live updates, Sheets is the natural pick. For a single user building a depreciation model with Power Query pulling from an SQL database, Excel 16.93 is the tool that does not apologise for its local-first design. In practice, many offices run both: Sheets for collaborative lists and quick sharing, Excel for the models that feed into the board deck.
- Charts — new chart types added to the library
- Ideas — built-in tool for visualising data patterns and trends
- macOS: 13 or later
- Architecture: Apple Silicon (ARM) and 64-bit Intel
Questions on file
Does Excel 16.93 run natively on Apple Silicon?
Yes, the application includes native ARM code alongside 64-bit x86 support, so it runs without Rosetta translation on M-series chips.
Sign in · Create an account to add a field note.
No field notes yet. A measurement, a version, a machine — they appear after moderation.