
Mac Apps
Mole 1.14.0
Mac AppsUpdated

| Requirement | On file |
|---|---|
| macOS | macOS 14 or later |
| CPU | Apple Silicon, Intel 64-bit |
| Download | 20 MB |
Smart Update for third-party apps is one of the sharper additions in build 1.14.0. Rather than simply flagging an outdated version, Mole fetches the installer from the developer’s site and handles the swap while you carry on. If you cancel mid-flow, it remembers the download and reuses it next time — a small logic touch that saves bandwidth on a metered connection.
| Detail | Value |
|---|---|
| Current version | 1.14.0 |
| Architecture | ARM and x86 64-bit |
| Minimum OS | macOS 14 |
| Languages | 9, including English, German, Japanese, Korean, Simplified Chinese |
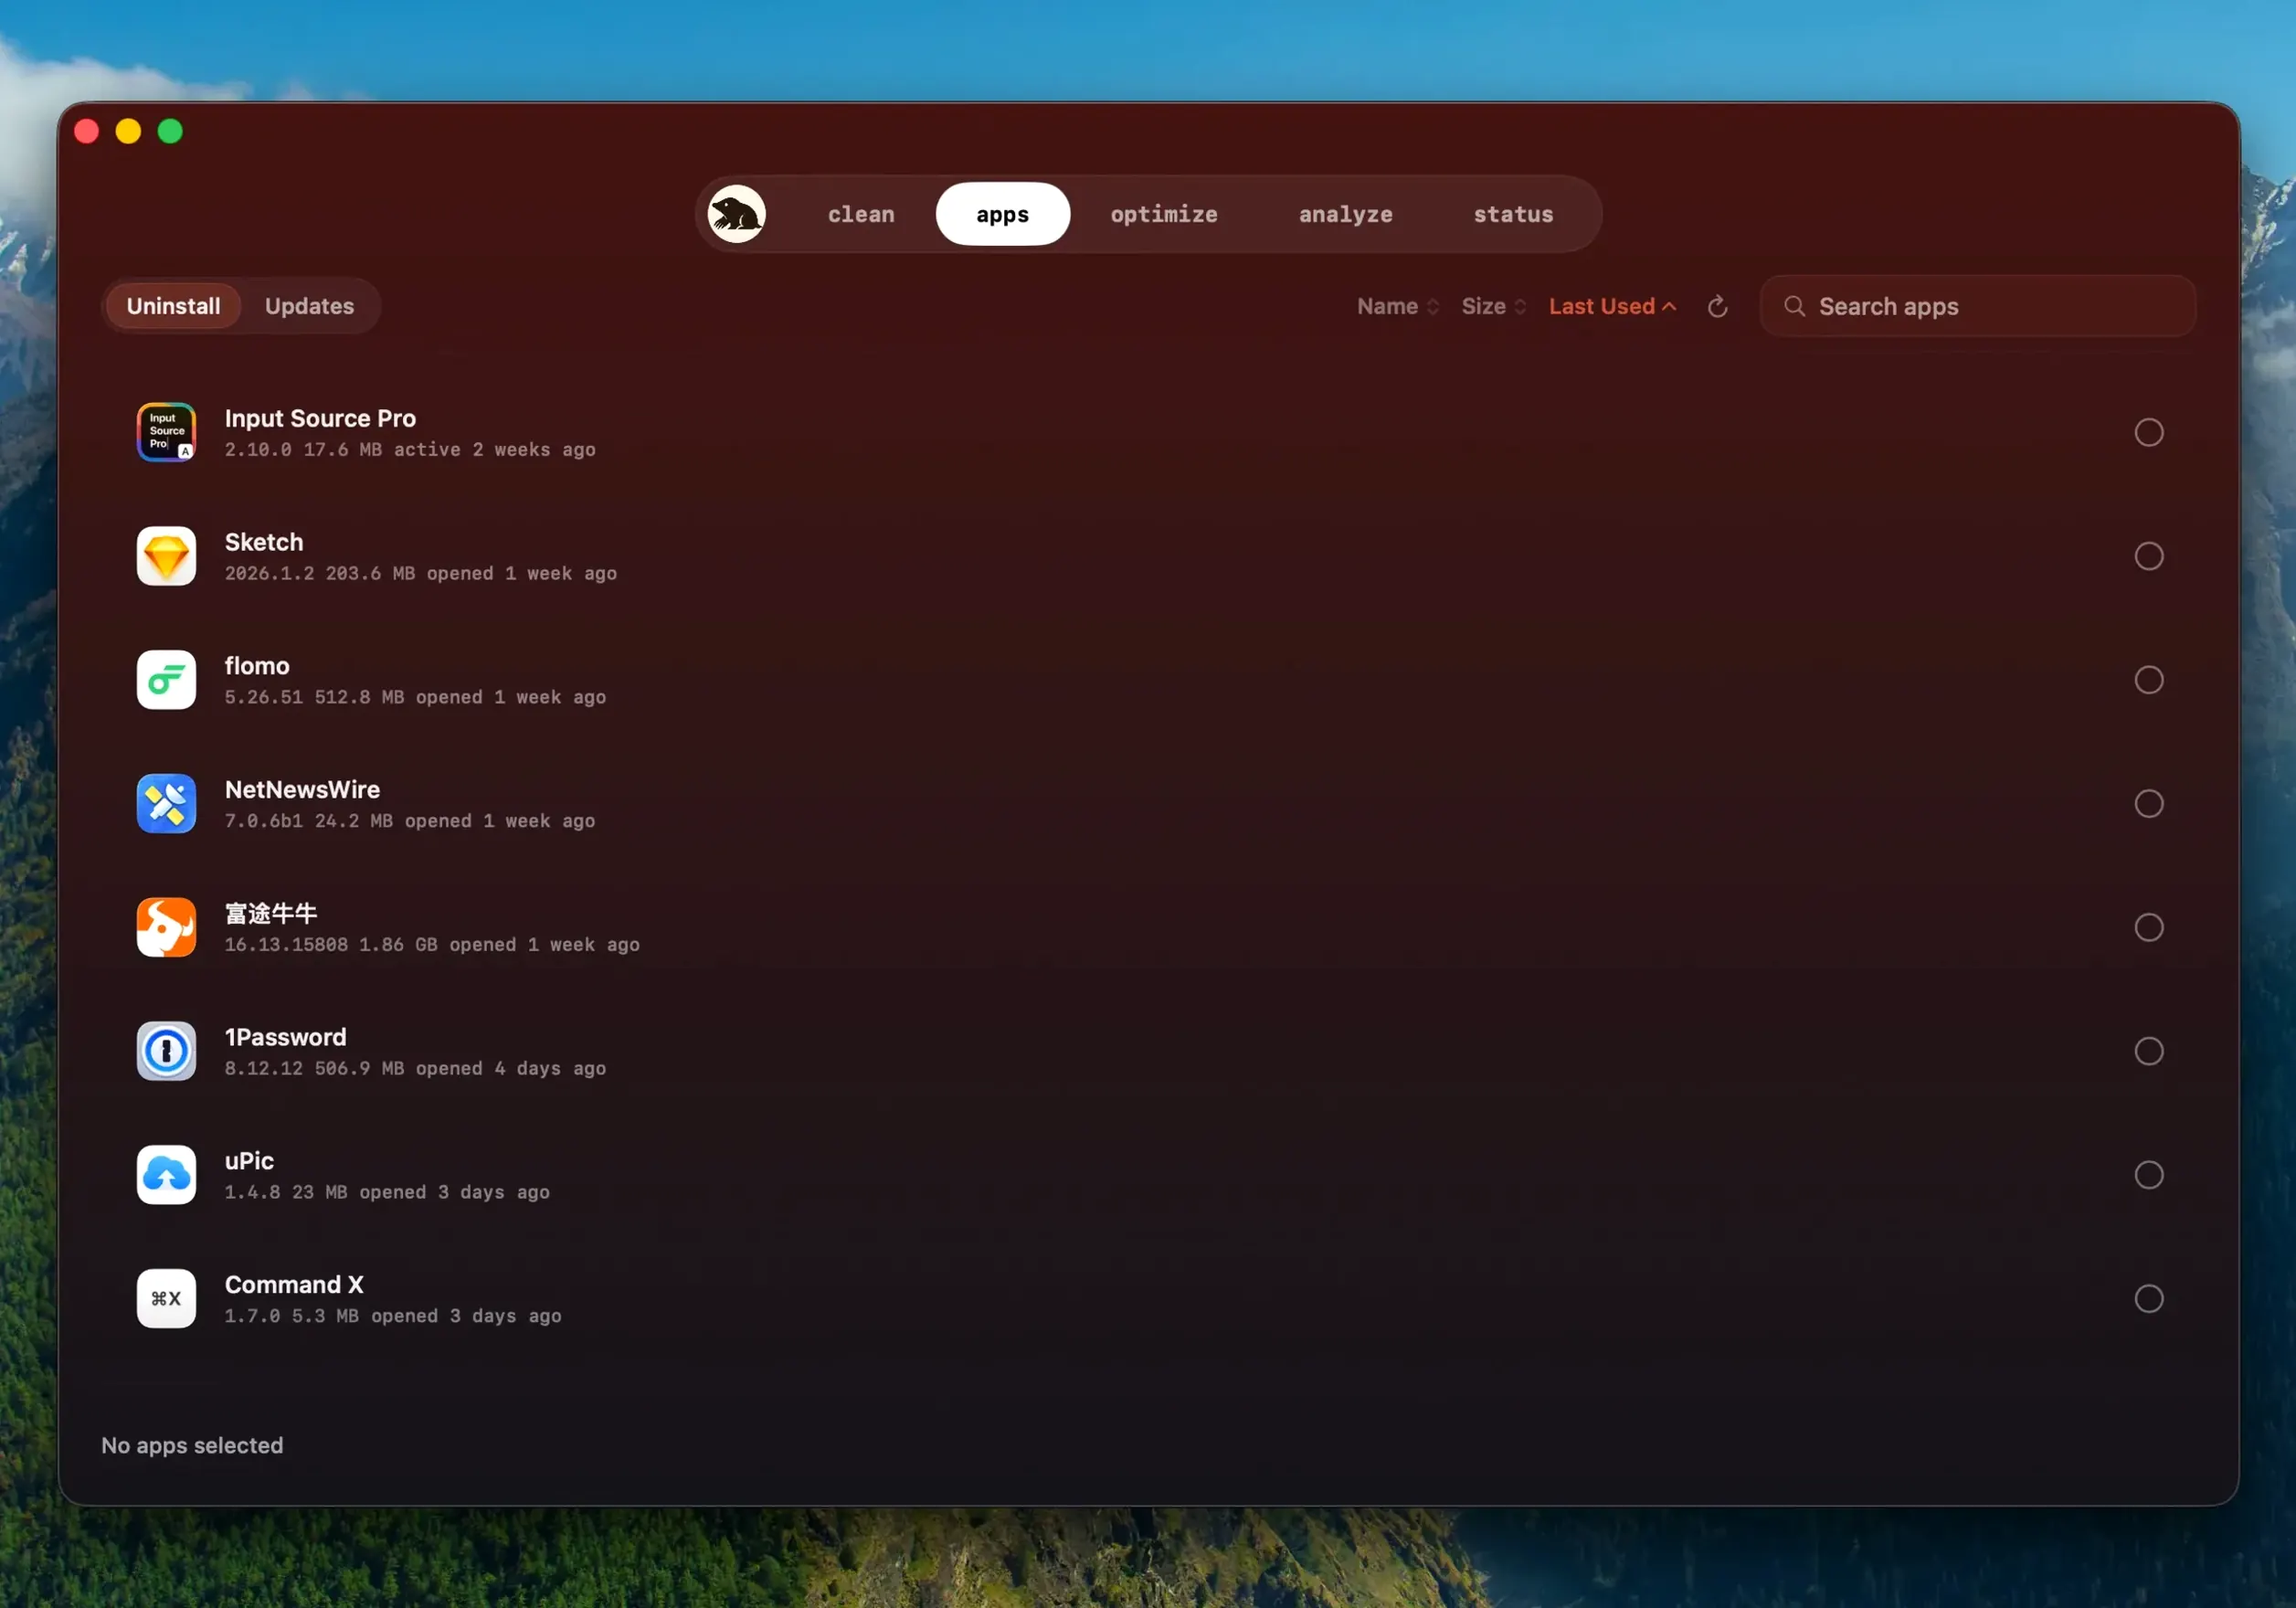
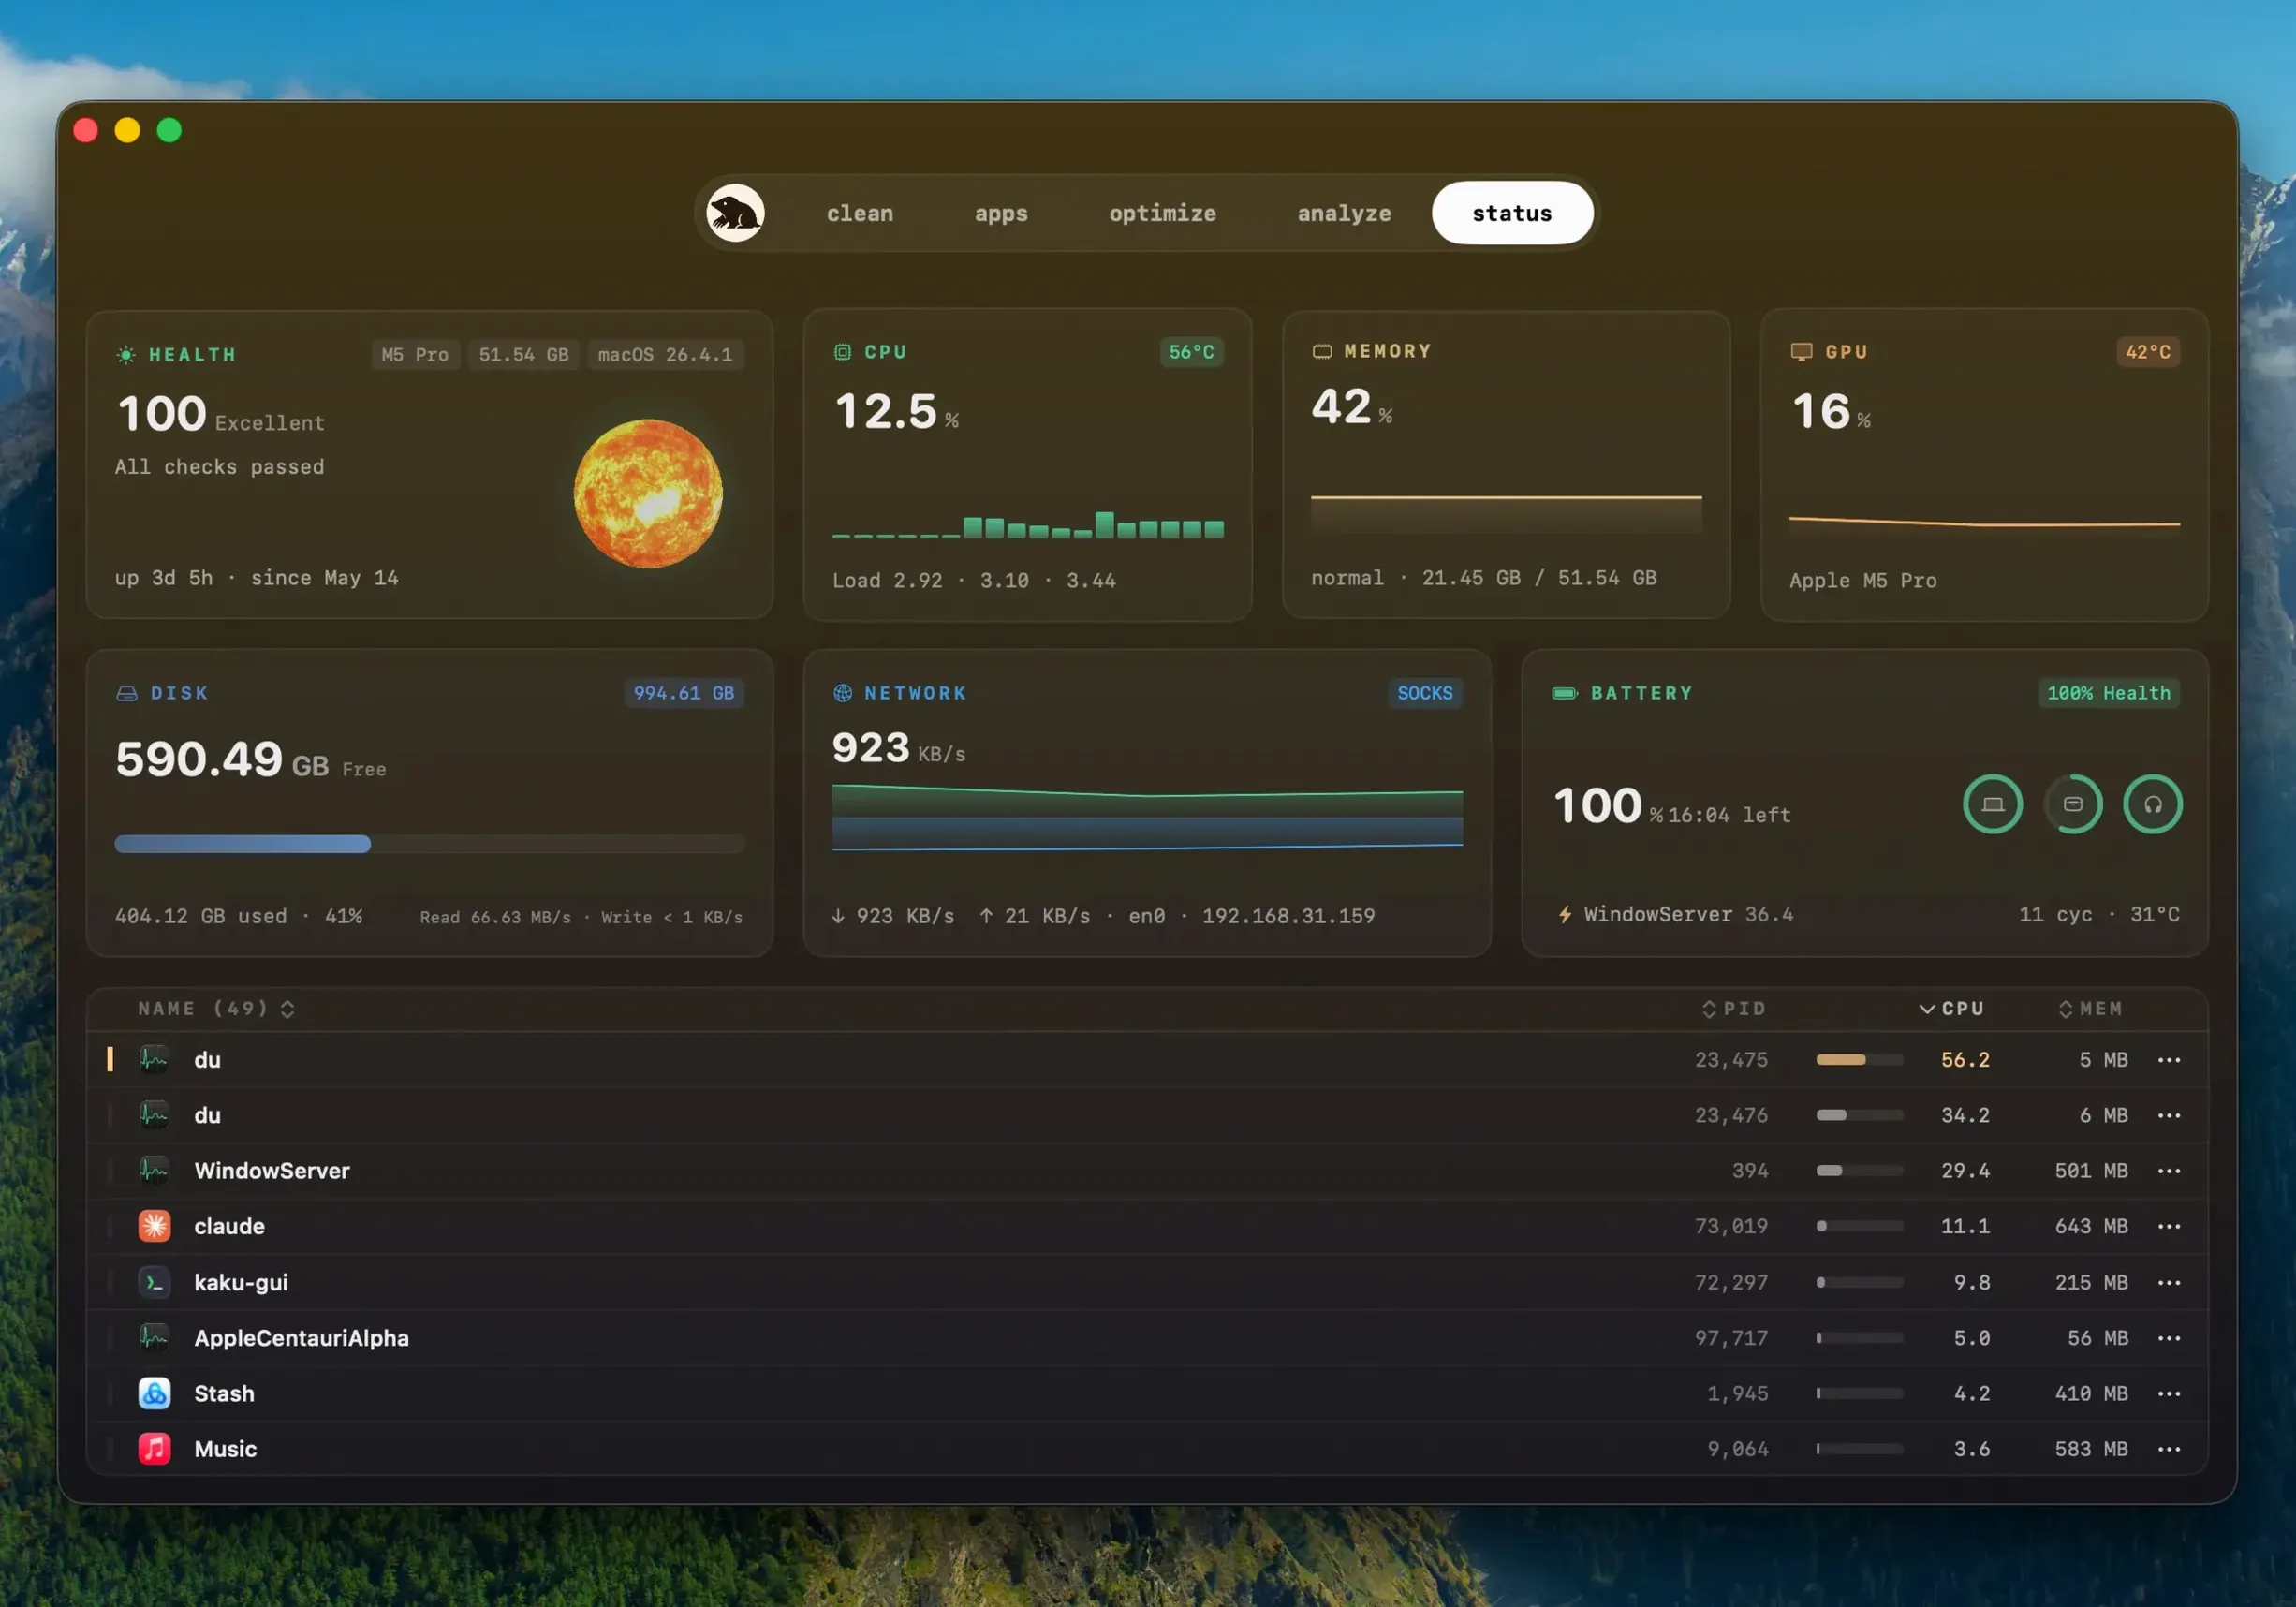
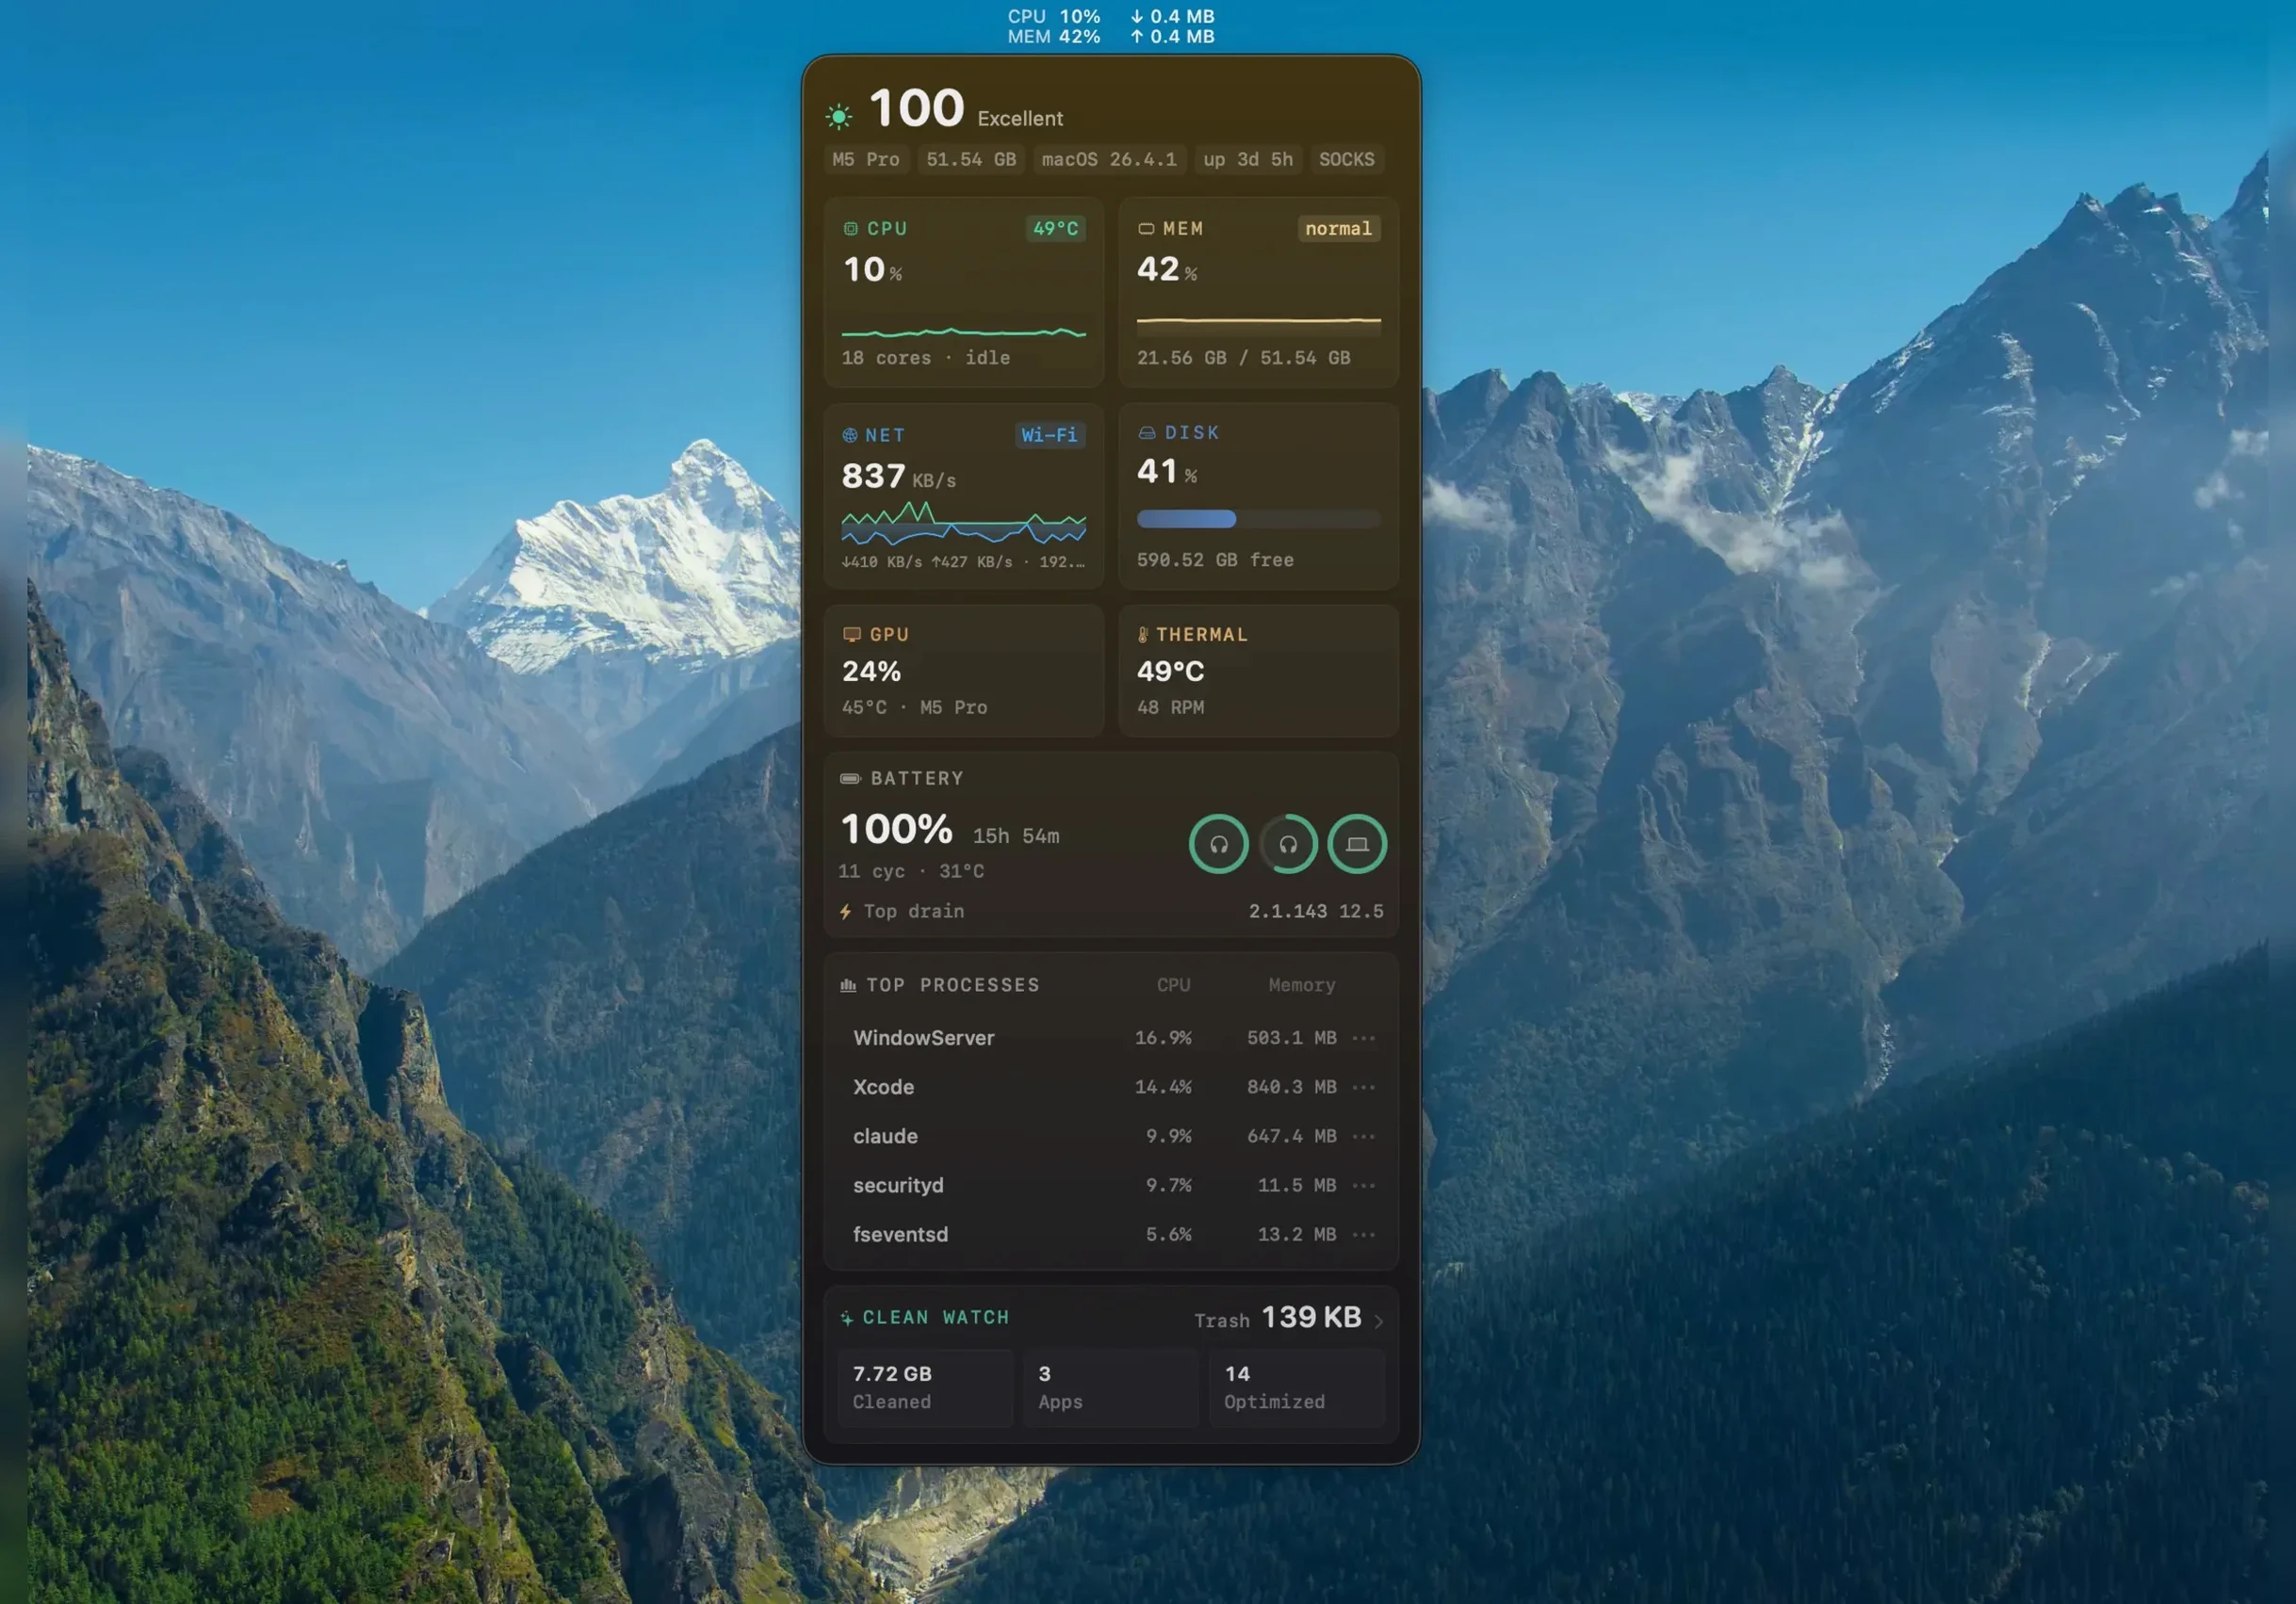
The app pulls five jobs under one roof: junk file cleaning, app uninstallation with leftover detection, a real-time hardware monitor, a system analyser, and the updater module. Before any cleanup runs, you get an itemised list with file sizes — caches, logs, temporary files — and the app waits for confirmation. The sensor panel reads CPU, GPU, memory, disk throughput, network speed, battery charge and internal temperatures. It’s a separate download from the CLI project of the same name, and it asks permission before quitting a running app during an update, then relaunches it afterwards.
Under-20-Second Cache Scan on a 512 GB SSD
After a few days of daily use, Mole settles into a predictable rhythm. The initial scan — the one that crawls ~/Library for orphaned caches and application leftovers — finishes in under 20 seconds on a 512 GB SSD with about 60 % filled. Subsequent scans run faster because the index is warm; I’ve seen 8–11 seconds on a 2023 M2 MacBook Air. The deep scan mode, which requires Full Disk Access, adds maybe 15 seconds and pulls in system-level logs the standard pass skips.
Memory pressure stays low. Activity Monitor reports 110–140 MB of wired RAM while Mole idles in the menu bar. During a cleanup run that figure bumps to 240 MB briefly and drops back within 3–4 seconds. CPU usage sits at 0.1–0.3 % when the sensor panel updates every 2 seconds. There is no persistent daemon; the helper process wakes on a timer, polls the hardware sensors, then sleeps again. If you close the status bar widget, Mole releases that RAM entirely and waits in the Dock.
The only time the fan spun up in a week of testing was during a tree map analysis of a 4 TB external drive with 800 000 files. That job pushed one performance core to 78 % for 90 seconds. For the internal SSD with typical usage patterns, the analyser completes its walk and draws the treemap in 15–30 seconds without crossing 40 % CPU.
Stability has been uneventful, which is what you want from a maintenance tool. No kernel panics, no hung scans, no sudden logout. Once, when a scan was cancelled mid-way while an external APFS volume disconnected, Mole threw a quiet error in the log and returned to the home screen. On relaunch it picked up cleanly. The database that stores scan history is a single SQLite file in ~/Library/Group Containers/; it weighed 4.7 MB after ten full scans across two drives.
Sidebar Software Updater Replaces Manual Update Hunts
Build 1.14.0 folded the software updater directly into the sidebar, which reshapes the morning routine. Before, updating apps sourced from outside the App Store meant launching each one, clicking around for a “Check for Updates” menu item, and babysitting disk images. Now Mole polls the Sparkle feeds and direct-download URLs once a day and presents a unified list. The detection logic for a newer build of the same version string — say, 1.13.0 build 204 versus build 202 — catches hotfixes that would otherwise slip past a simple version-number check.
The 1.13.0 release introduced the sensor panel redesign, moving from a static table to the current live-chart view. That changed how I monitor battery health: instead of reading a percentage, I now see a 60-minute charge/discharge curve. The 1.12.1 build fixed a bug where APFS snapshots on Time Machine volumes were counted twice in the disk usage treemap, which had skewed capacity numbers by 15–20 GB on some Macs. Version 1.8.0 was the first to separate “application leftovers” from generic system junk, giving users a distinct category with its own confirmation toggle — a small UX shift that prevented a few accidental purges of preference files people intended to keep.
Grant Full Disk Access to Surface Hidden 60 % of Cache Data
Grant Full Disk Access in System Settings before the first scan. Without it, Mole cannot read ~/Library/Containers/ or /private/var/folders/, which hides roughly 60 % of the cache data it would otherwise surface. The prompt appears automatically on first launch; if you dismiss it, the “Privacy” tab inside the app preferences offers a second chance.
Run a standard scan on day one and review every category before clicking “Clean.” The itemised list shows file counts and aggregate sizes. Expand the disclosure triangles to see individual paths — there is almost always a folder or two worth excluding. I exclude ~/Library/Application Support/Firefox/Profiles/*/cache2 by habit because Firefox rewrites those entries on the next launch anyway, and deleting them mid-session forces a cold restart of the browser’s network stack.
Let the hardware sensor panel run in the menu bar for a full 24 hours. The temperature data, in particular, takes a full day-night cycle to establish a baseline. After that period, the “High Temperature” alert threshold in preferences can be set to a value that reflects your actual thermal envelope, not a generic 85 °C. For Apple Silicon laptops under sustained load, 92–95 °C is normal; for Intel models with thermal paste a few years old, 88 °C might be the real ceiling.
If you used a Mole torrent or a Mole Mac crack in the past to test the CLI tool, note that the Mac app is a separate codebase and does not share configuration with the command-line version. Delete any leftover plist files from ~/Library/Preferences/ that carry old build identifiers before the first run, otherwise the app may skip its first-launch wizard.
Orange Dot Warns When System Volume Crosses 85 % Usage
The menu bar widget blinks a small orange dot — disk usage on the system volume has crossed 85 %. I click it, and the full app opens to the “Cleanup” tab. A scan from three hours ago is still cached, but the “Re-scan” button in the toolbar is faster than trusting stale data, so I tap it. Thirteen seconds later the result list populates.
System Caches sits at 4.2 GB. I expand it: Xcode’s DerivedData accounts for 2.8 GB alone, a project I archived last week. Application Logs adds 340 MB, mostly Console.app entries from a kernel extension I debugged and then removed. I uncheck a 120 MB folder under ~/Library/Developer/CoreSimulator because I still need the iOS 17.4 runtime. Below that, Application Leftovers lists two entries — a preference pane from a video converter I dragged to the Trash six months ago and a LaunchAgent that still tries to load at login. The total deletable payload is 5.8 GB.
I switch to the “App Uninstaller” tab and search for the video converter by name. Mole shows the binary, the receipt in /Library/Receipts, a Daemon plist, and a 450 MB folder of transcoding presets in Application Support. I select all and confirm. The uninstall runs in 4 seconds; the leftover entry in the Cleanup tab disappears on the next scan.
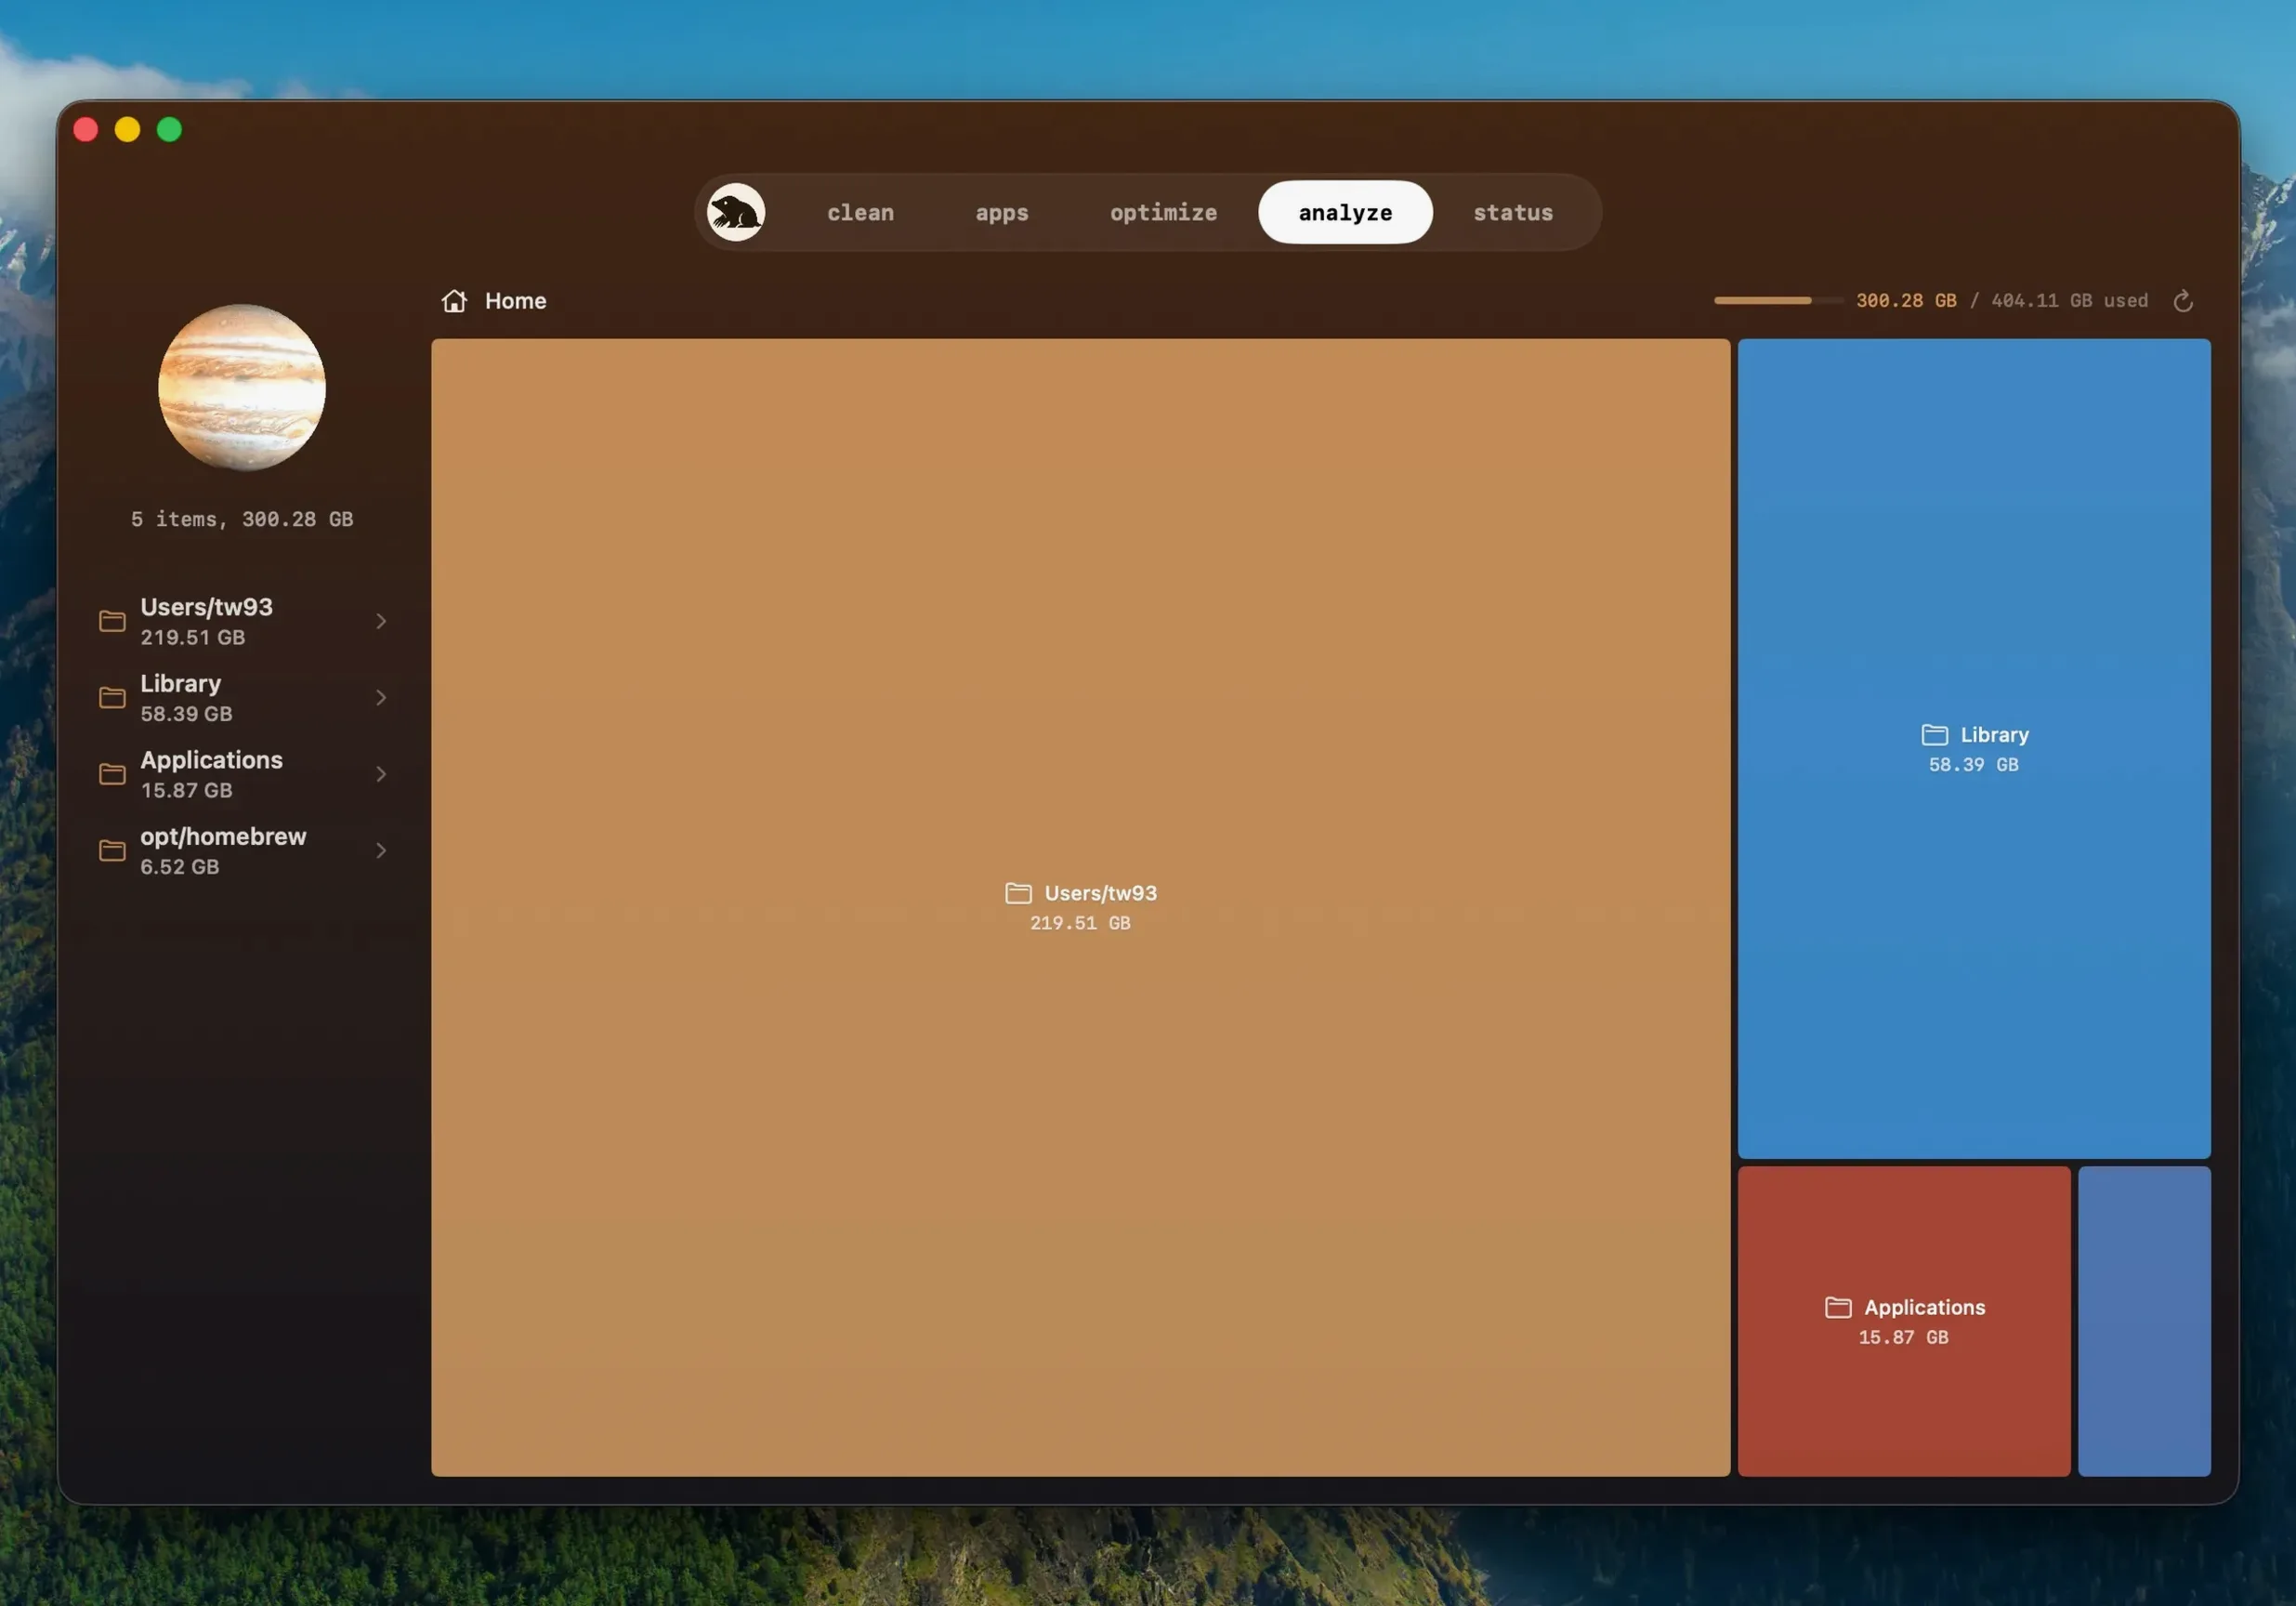
Next I open “Analysis” and point it at the Downloads folder, which has ballooned to 190 GB. The treemap renders in 22 seconds. A single blue rectangle representing a 50 GB virtual machine image dominates the canvas; three disk images of old Linux ISOs add another 35 GB. The treemap is clickable — I select the three ISO blocks, right-click, and pick “Reveal in Finder.” I move them to an external drive manually rather than deleting through Mole, because the app’s delete-from-analysis feature requires confirmation per file and I have 11 files inside those disk images.
Back in the “Status” tab, the live charts show memory pressure at 42 %, GPU at 6 %, and the battery sitting at 74 % with a discharge rate of 8.1 watts. The network graph shows a flat line — the background updater finished pulling the latest build of a Markdown editor two minutes ago, and Mole already prompted me to quit and reopen it. The whole session from menu bar alert to closing the window took under 6 minutes.
- App updates — Third-party apps downloaded from websites can now update inside Mole without opening a browser.
- Download reuse — A finished download is kept and reused when an earlier update attempt was cancelled.
- Build detection — The app recognises a newer build of the same version number.
- Update flow — Mole asks before quitting a running app and reopens it after installation completes.
- macOS 14 or later
- Apple Silicon or Intel 64-bit Mac
- Full Disk Access permission recommended for cleanup functions
Questions on file
Does Mole show what it will delete before cleaning?
Yes. The app lists every file along with its size and waits for user confirmation before it removes anything.
Sign in · Create an account to add a field note.
No field notes yet. A measurement, a version, a machine — they appear after moderation.