
Mac Apps
TG Pro 2.104
Mac AppsUpdated
| Requirement | On file |
|---|---|
| macOS | macOS 10.13 or later |
| CPU | Intel 64-bit |
| Download | 15 MB |
A single menu bar icon can show the current temperature of your CPU, GPU, and the speed of every fan inside your Mac. Version 2.103 extends complete fan control to M4, M4 Pro, and M4 Max systems.
What sits next to Activity Monitor
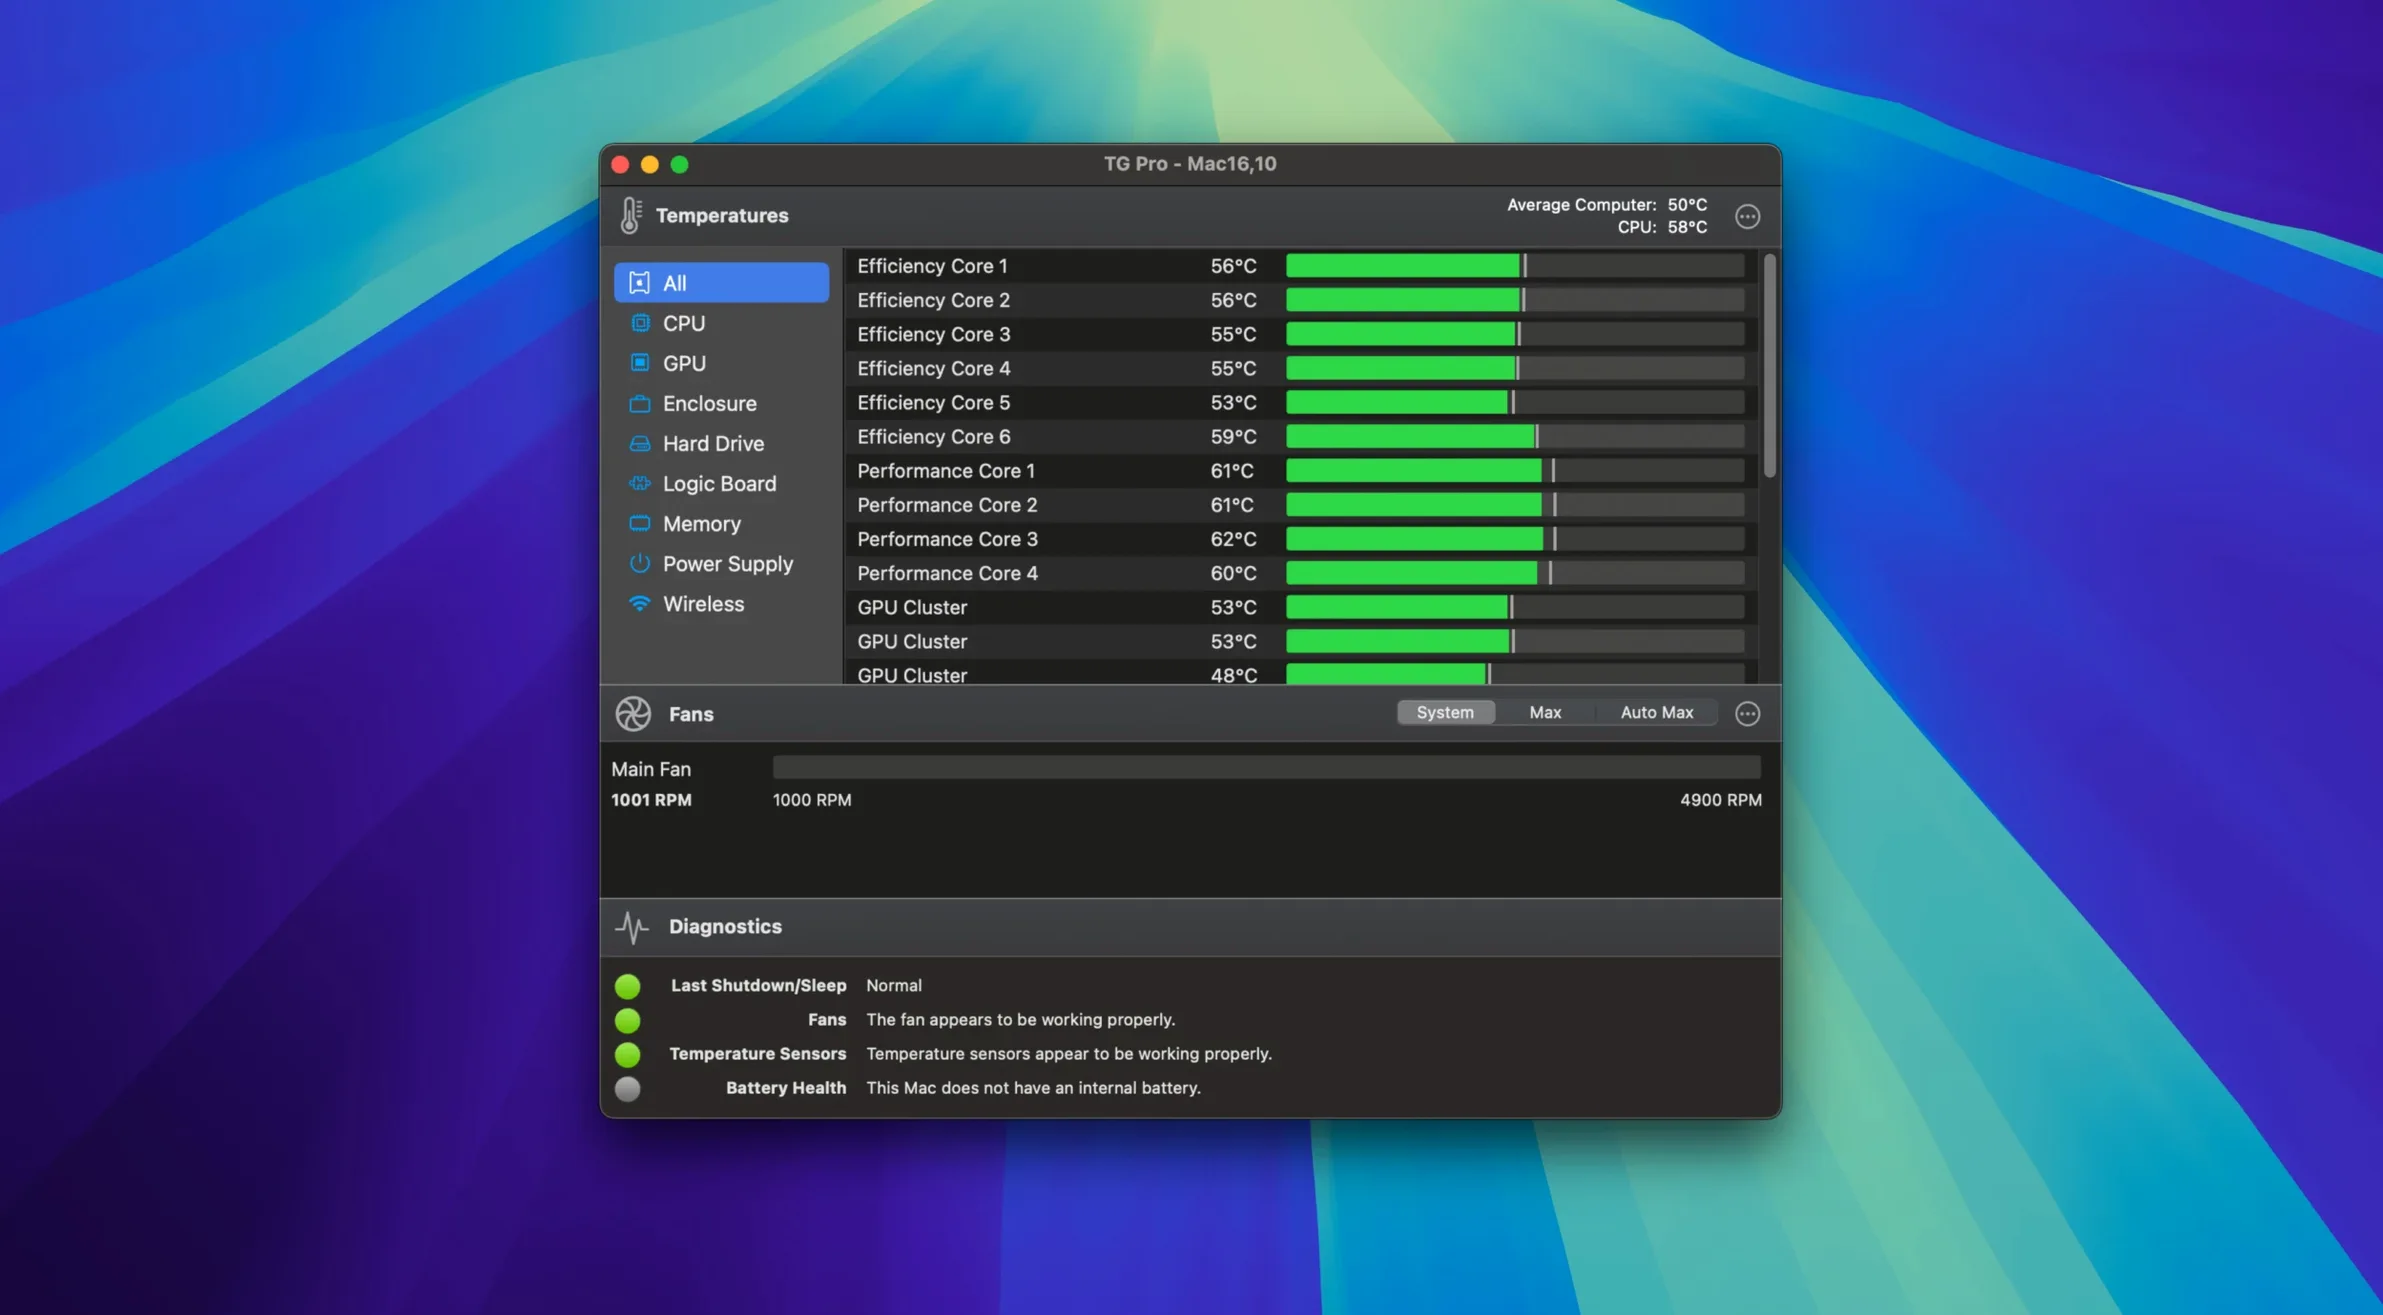
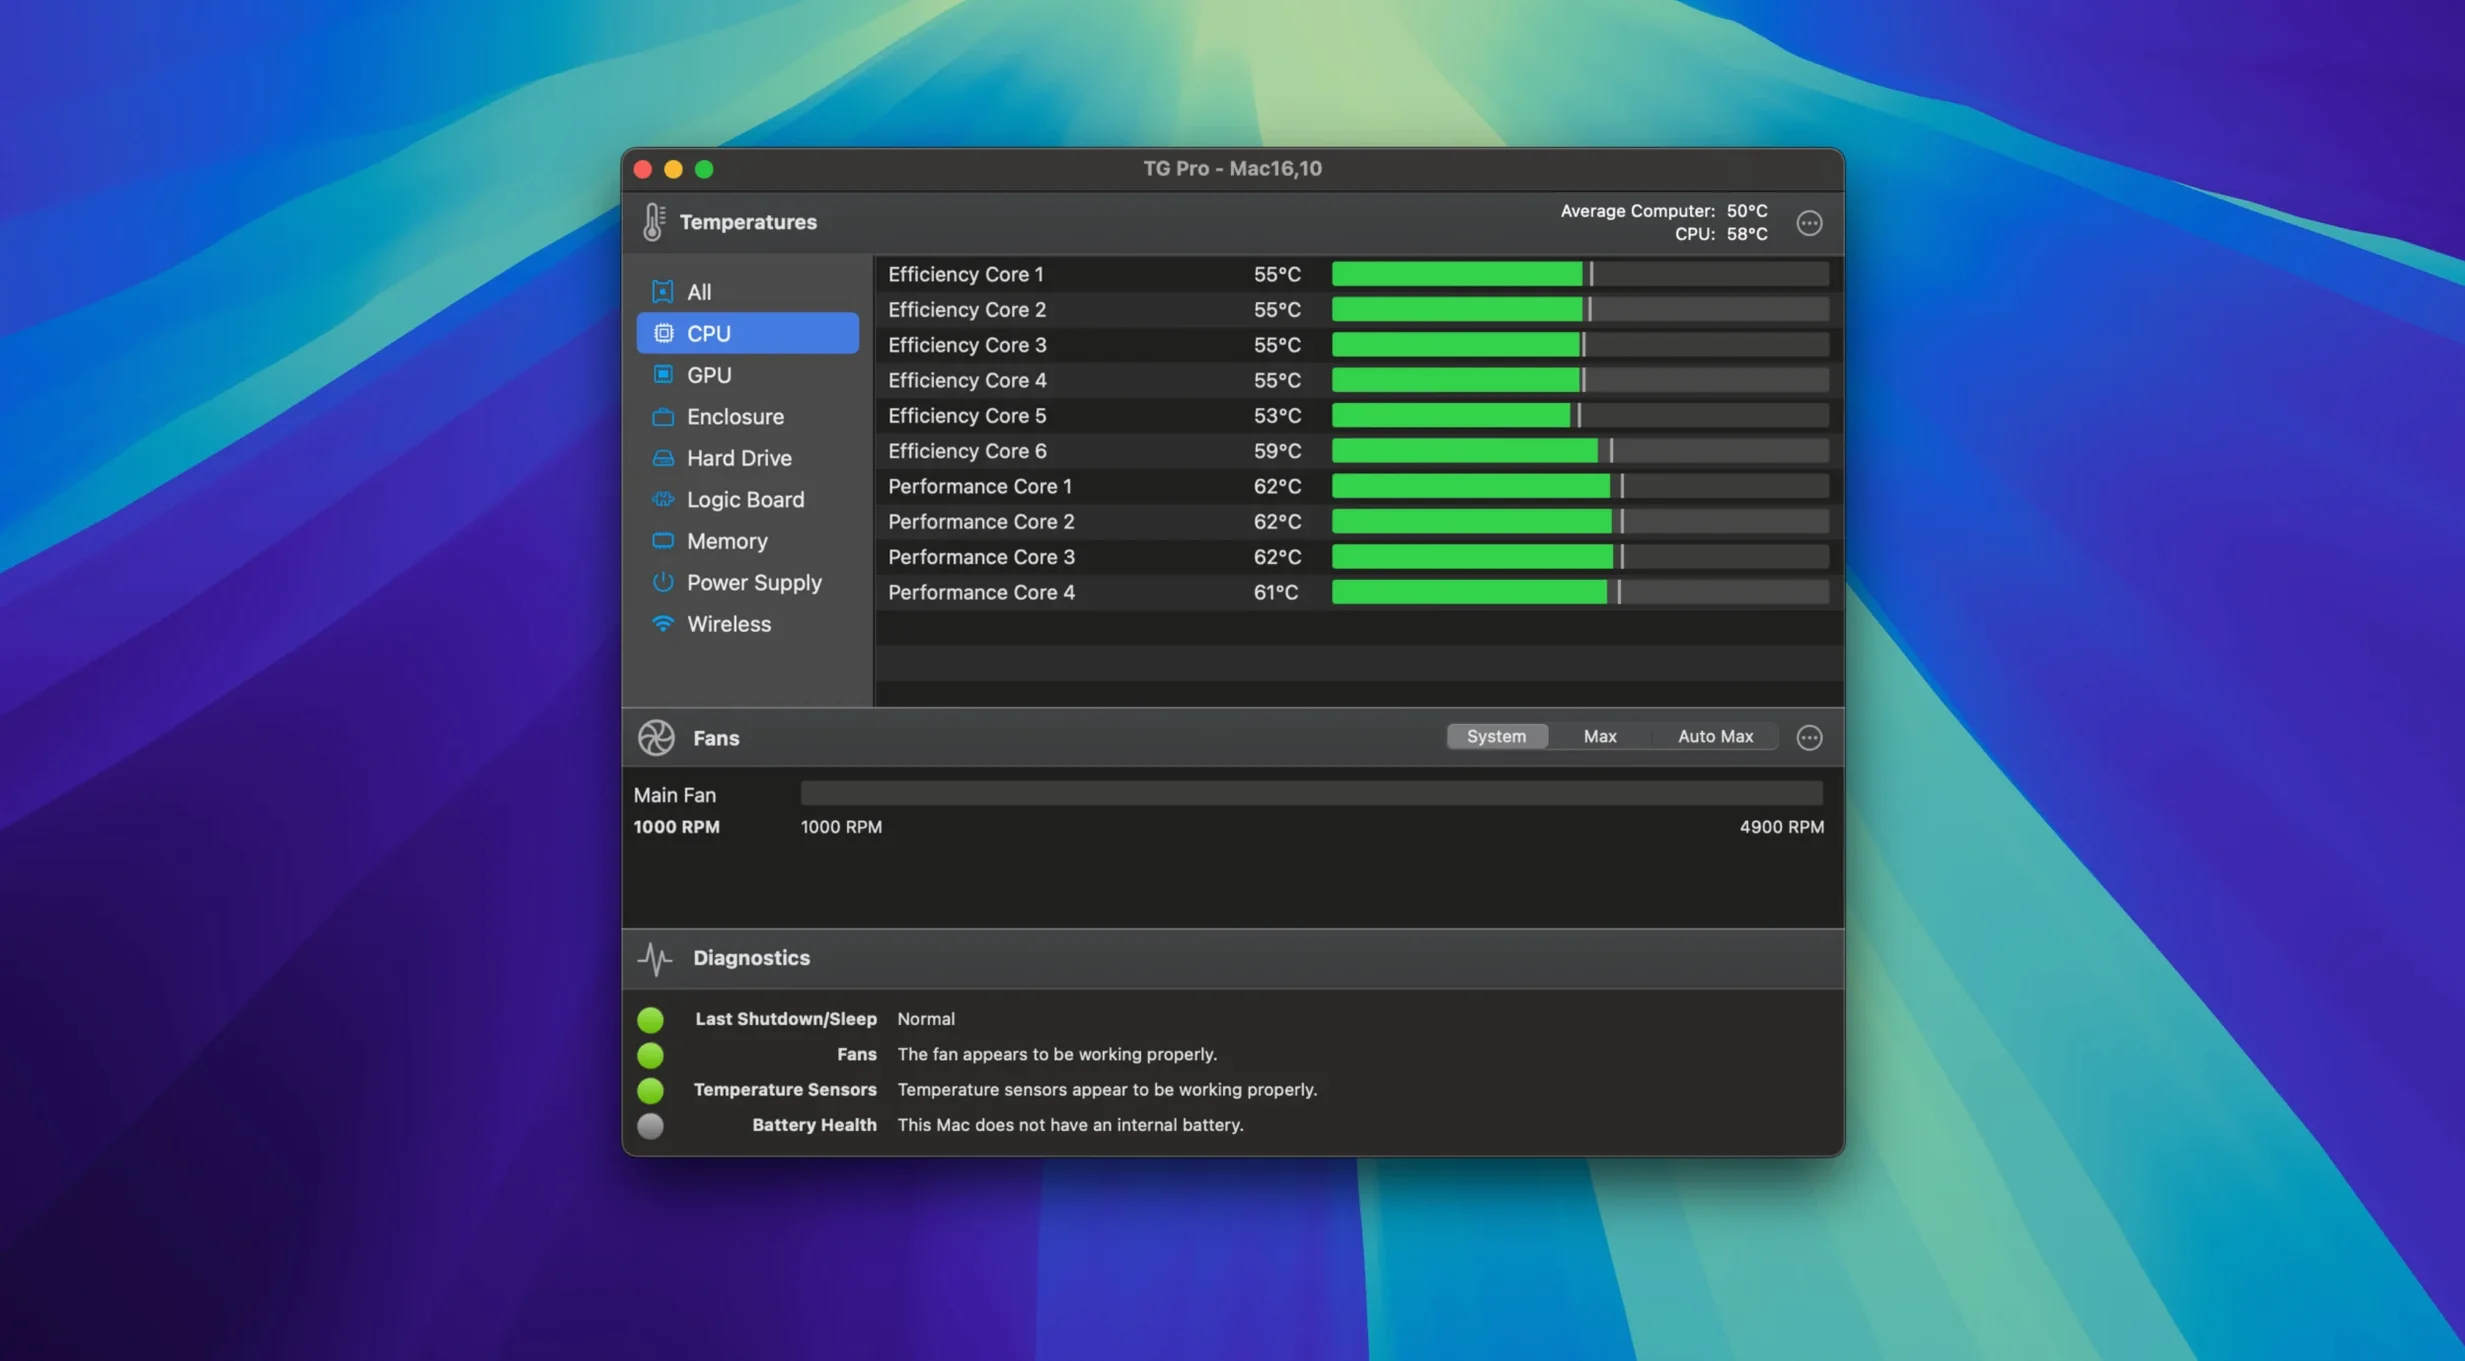
Activity Monitor shows CPU load and energy use, but it tells you nothing about heat. TG Pro fills that gap. It reads every sensor the hardware exposes: CPU cores, GPU die, logic board, memory modules, Wi‑Fi chip, internal drives, and battery on laptops. The data sits in a drop‑down panel from the menu bar, so you can watch a render heat up the machine without switching windows.
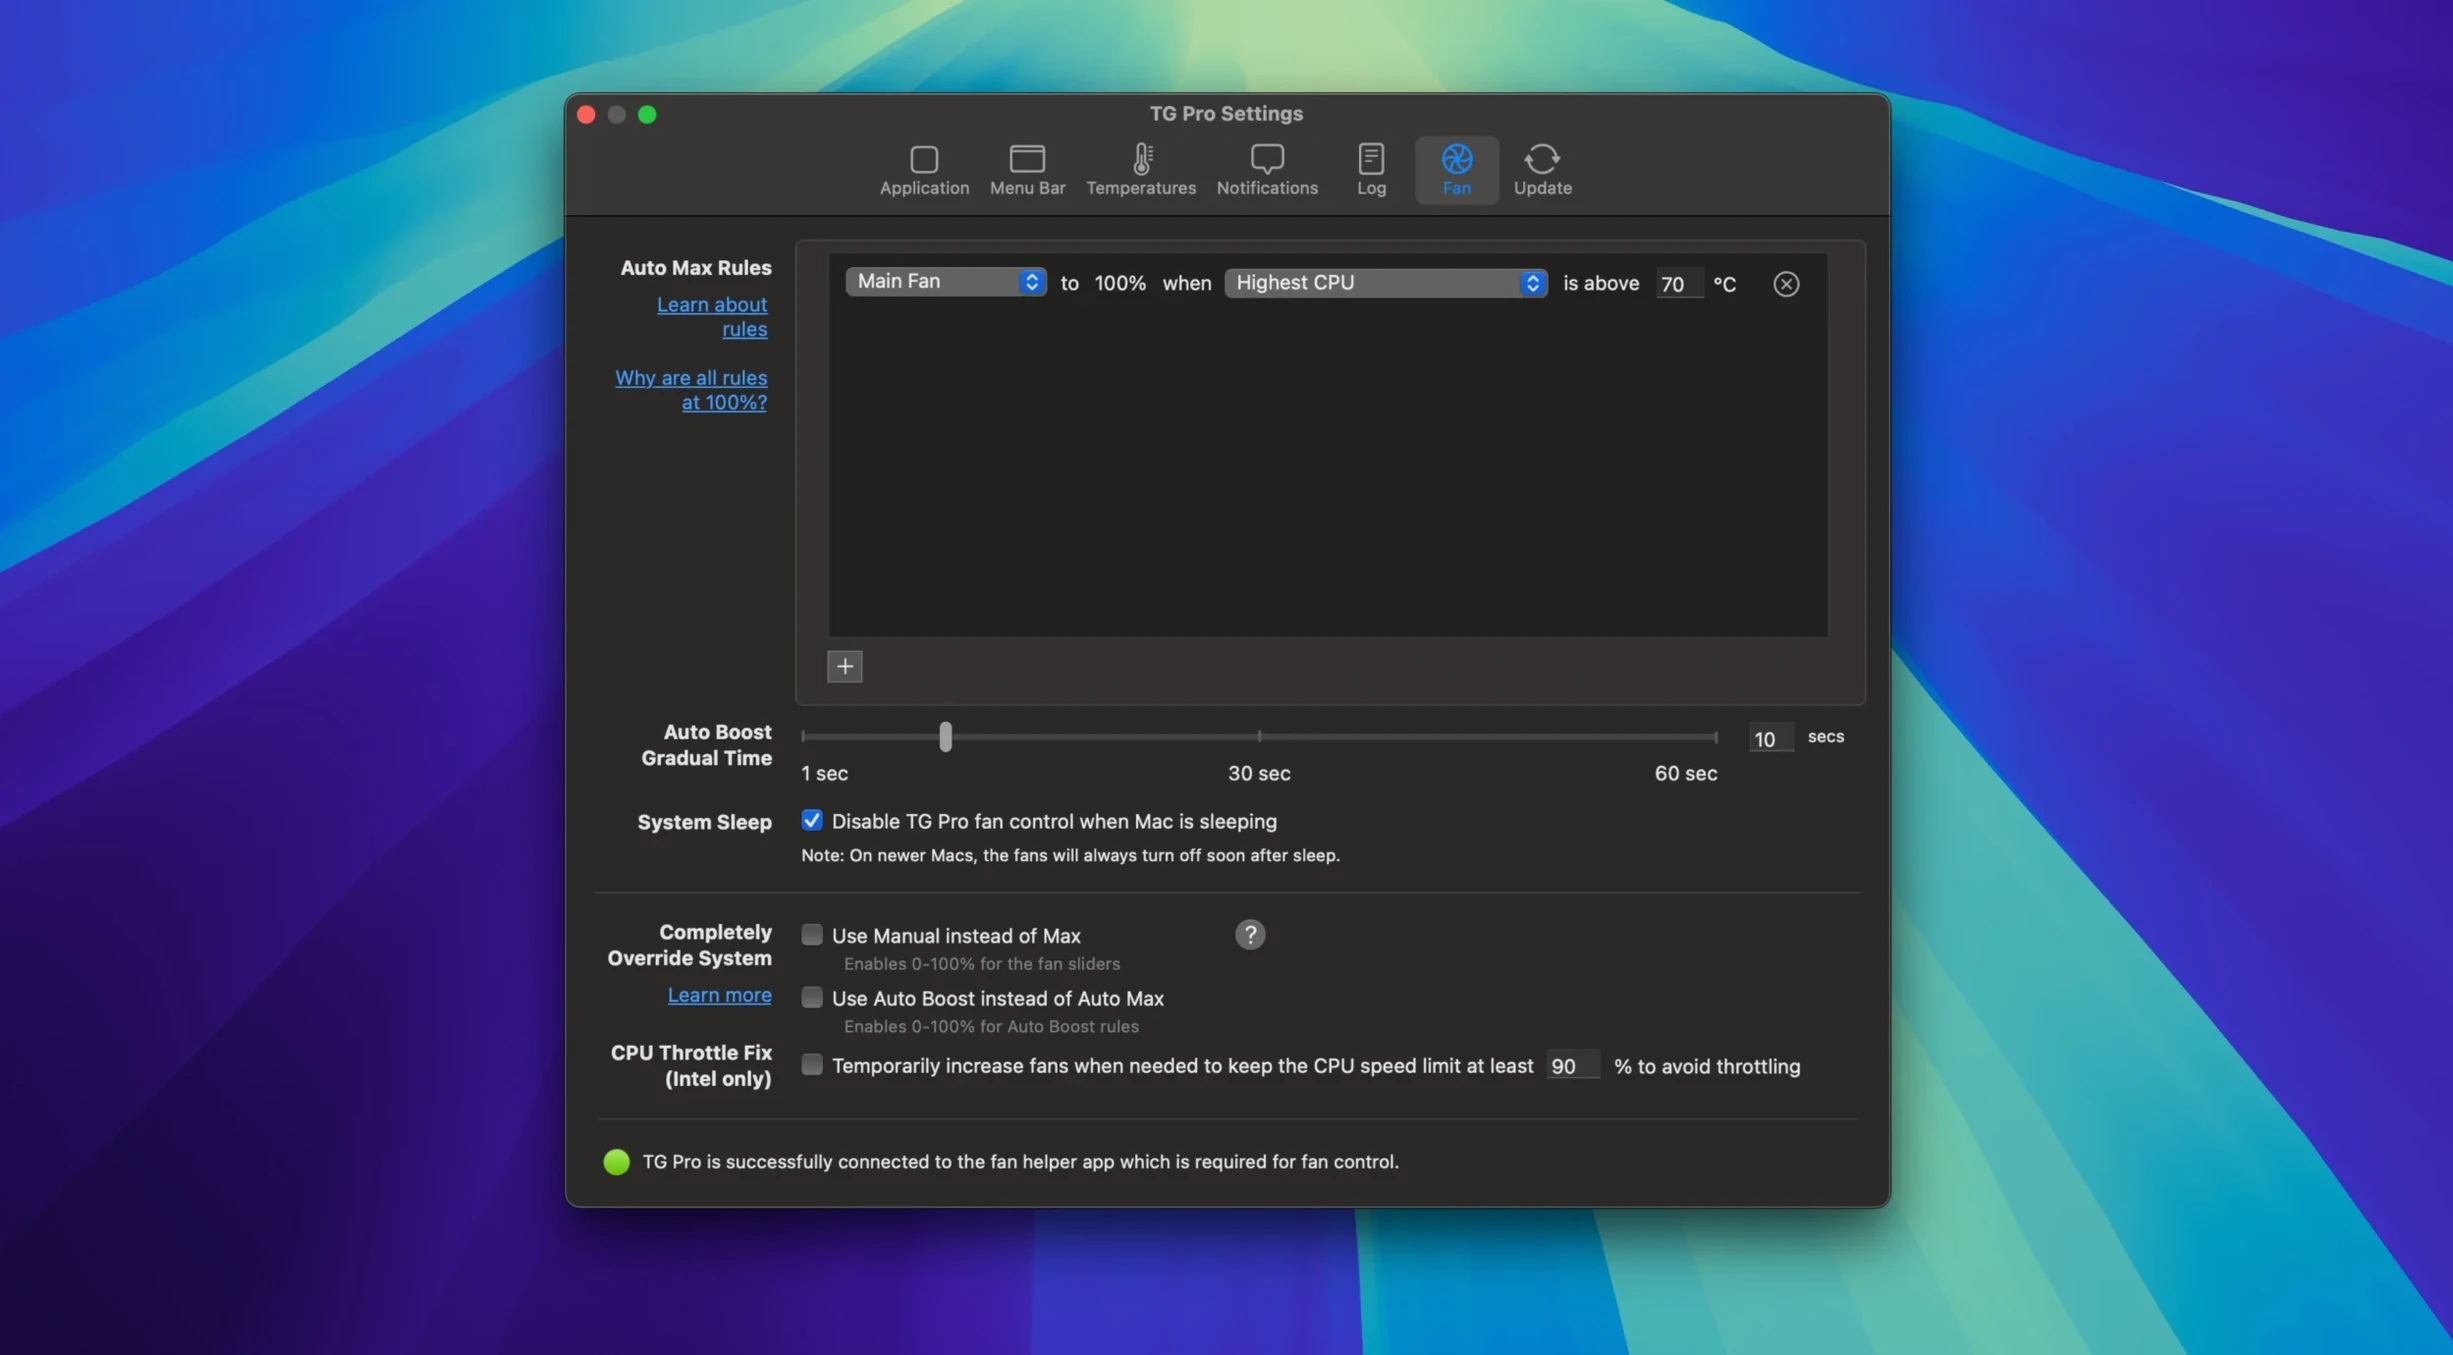
- Custom fan rules that ramp cooling based on any temperature sensor, not just CPU.
- A preference toggle that unlocks sensor read‑out and fan control on Hackintosh builds.
- Fan speed and temperature data always visible in the menu bar.
Where the limits sit
TG Pro reads what the SMC gives it. On some Macs, Apple exposes fewer sensors; on others, the firmware blocks manual fan control below a certain speed floor. The app cannot override hardware protection that throttles a machine to prevent damage. What it does is give you the same diagnostic view that Apple’s own internal tools use, plus the ability to set a fan curve that prioritises lower temperatures over silence when you need it. It runs on Intel 64‑bit Macs and Apple Silicon, from macOS 10.13 High Sierra through to the latest release.
One-Source Fan Profiles vs. TG Pro’s Sensor Depth
Macs Fan Control is the name most people reach for first. It reads fewer sensors than TG Pro and ties fan speed to a single temperature source per profile. If you only need to pin the exhaust fan to the CPU diode, it works. TG Pro pulls data from every sensor the SMC exposes—logic board, memory, Wi‑Fi, individual disk drives—and lets you build rules that watch more than one at a time. That matters when a Thunderbolt enclosure heats up independently of the SoC.
iStat Menus puts temperatures in the menu bar with a lot of polish, but its fan control is secondary to its monitoring dashboard. TG Pro flips the priority: fan control and sensor diagnostics are the core, and the menu bar display is a lightweight read‑out, not a full system monitor. If you want network graphs and disk activity side by side, iStat Menus does that. If you want a rule that spins fans to 80% when the GPU hits 72°C and holds them there until it drops below 60°C, TG Pro is the tool built for that.
Stats is an open‑source menu bar monitor that shows temperatures for free. It has no fan control, no logging, and no diagnostic tests. It is a read‑only glance at a handful of sensors. TG Pro gives you a full sensor list, per‑component diagnostics, and the ability to write conditional fan rules—features Stats does not attempt.
First three days after installing
In the first hour, run the built‑in diagnostics once. Open TG Pro, click the Diagnostics tab, and let it scan the fans, sensors, and cooling system. It will report whether every fan spins through its full range and whether any sensor returns implausible values. That baseline tells you the hardware is healthy before you start adjusting anything.
On day one, don’t create a custom rule. Instead, leave the fans on Auto and watch the temperature graph during a normal heavy task—exporting 50 raw photos, compiling a project, or running a short HandBrake transcode. Note which sensor peaks first and how long the fans take to respond. Many Macs let the CPU climb to 90°C before the fans ramp noticeably. That lag is what you’ll tune later.
On day two, set a temperature alert for the hottest component you identified. Pick a threshold 5°C below the peak you saw. Let TG Pro send a notification or log the event without touching the fans. This teaches you how often that component crosses the line during a normal workday.
By day three, build your first rule. Use Auto Boost mode if you want a simple offset: you pick a target temperature and a maximum fan speed, and TG Pro interpolates the curve between them. The Auto Boost rules in version 2.103 now survive power source switches without failing—an earlier bug that could leave the fans stuck at idle after unplugging from AC.
Option-Click Menu Bar Icon for a Flat Sensor List
- Right‑click the menu bar icon and hold
Optionto reveal every sensor in a flat list, not grouped by component. Quicker than opening the main window when you want one number. - The main window’s fan row shows a percentage next to the RPM. Double‑click the number and type an exact speed to jump there instantly, bypassing the slider.
- In the Rules tab, you can duplicate an existing rule with
Cmd+Dand tweak it for a different sensor. Faster than building a second rule from scratch. - Hold
Shiftwhile clicking a column header in the sensor list to sort by that column’s values. Useful when you want to find the hottest component across 40+ sensors. - The log file—accessible from the Help menu—writes every temperature event to plain text. You can tail it in Terminal or feed it to a graphing tool if you want historical plots outside the app.
4K Noise Reduction Pushes GPU Past 50°C Within 30 Seconds
It’s 9:20am and the studio Mac Studio sits idle at 38°C on the CPU die. You open DaVinci Resolve and pull up a 4K timeline with noise reduction applied. The GPU package temperature climbs past 50°C within 30 seconds of playback.
You glance at the menu bar. TG Pro shows CPU 62°C | GPU 68°C | Fans 1340 RPM in a compact string. The fans are still at the default minimum; Apple’s firmware waits for the GPU to hit a higher threshold before it reacts.
You open the TG Pro window and switch to the Rules tab. There’s an existing rule called Render cooling that watches the GPU die and the GPU memory sensors simultaneously. It is set to ramp the main exhaust fan to 70% when either sensor exceeds 72°C, and to back off only when both drop below 58°C. You enable it with a single click.
Back in Resolve, you start the render. The GPU temperature crosses 72°C three minutes in. TG Pro pushes the fan to 2,800 RPM—audible but not intrusive. The temperature plateaus at 76°C instead of the 88°C it would have reached on Auto. You let the render finish, and five minutes after the GPU drops below 58°C, the fans quietly return to idle.
Before lunch, you plug in an external NVMe enclosure that runs hot under sustained writes. You open TG Pro’s sensor list, find the drive’s temperature sensor reporting 54°C, and note that the enclosure has no direct fan link. You create a new rule that watches that sensor and ramps the Mac’s PCIe fan to 45% when the drive hits 50°C. The drive cools to 44°C within two minutes. You leave the rule active and minimise TG Pro to the menu bar.
- macOS 10.13 or later
- Intel 64-bit processor
Sign in · Create an account to add a field note.
No field notes yet. A measurement, a version, a machine — they appear after moderation.