VST Plugins
MiniMeters 1.0.30.358
VST PluginsUpdated
| Requirement | On file |
|---|---|
| macOS | macOS 10.15 or later |
| CPU | Apple Silicon, Intel 64-bit |
| Download | 103 MB |
A minimum of macOS 10.15 is needed to run MiniMeters, on both Intel and Apple Silicon machines. Before looking at unofficial installs, a few practical questions about what the plug-in actually offers tend to come up first. Here is what the current build provides, based on the developer’s notes.
- Does it work outside a DAW? Yes. A standalone app is included for checking system audio without launching a host.
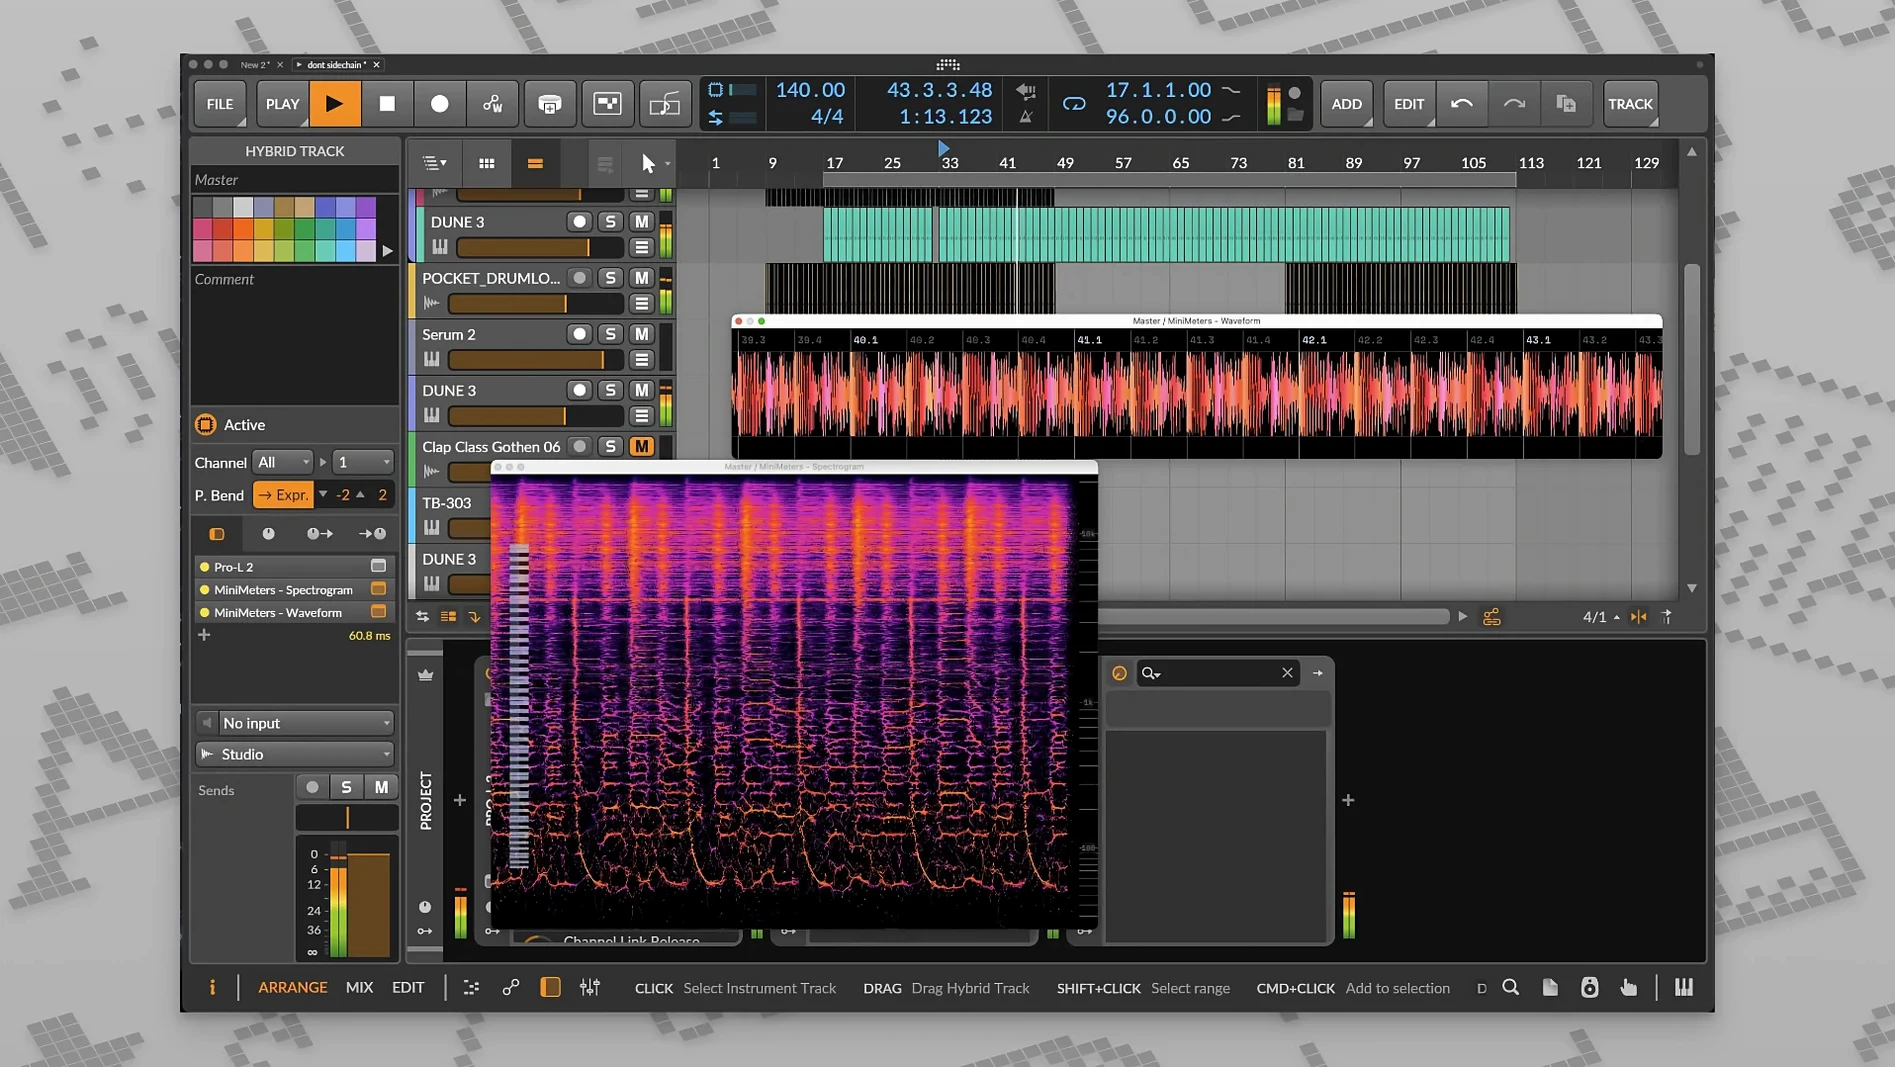
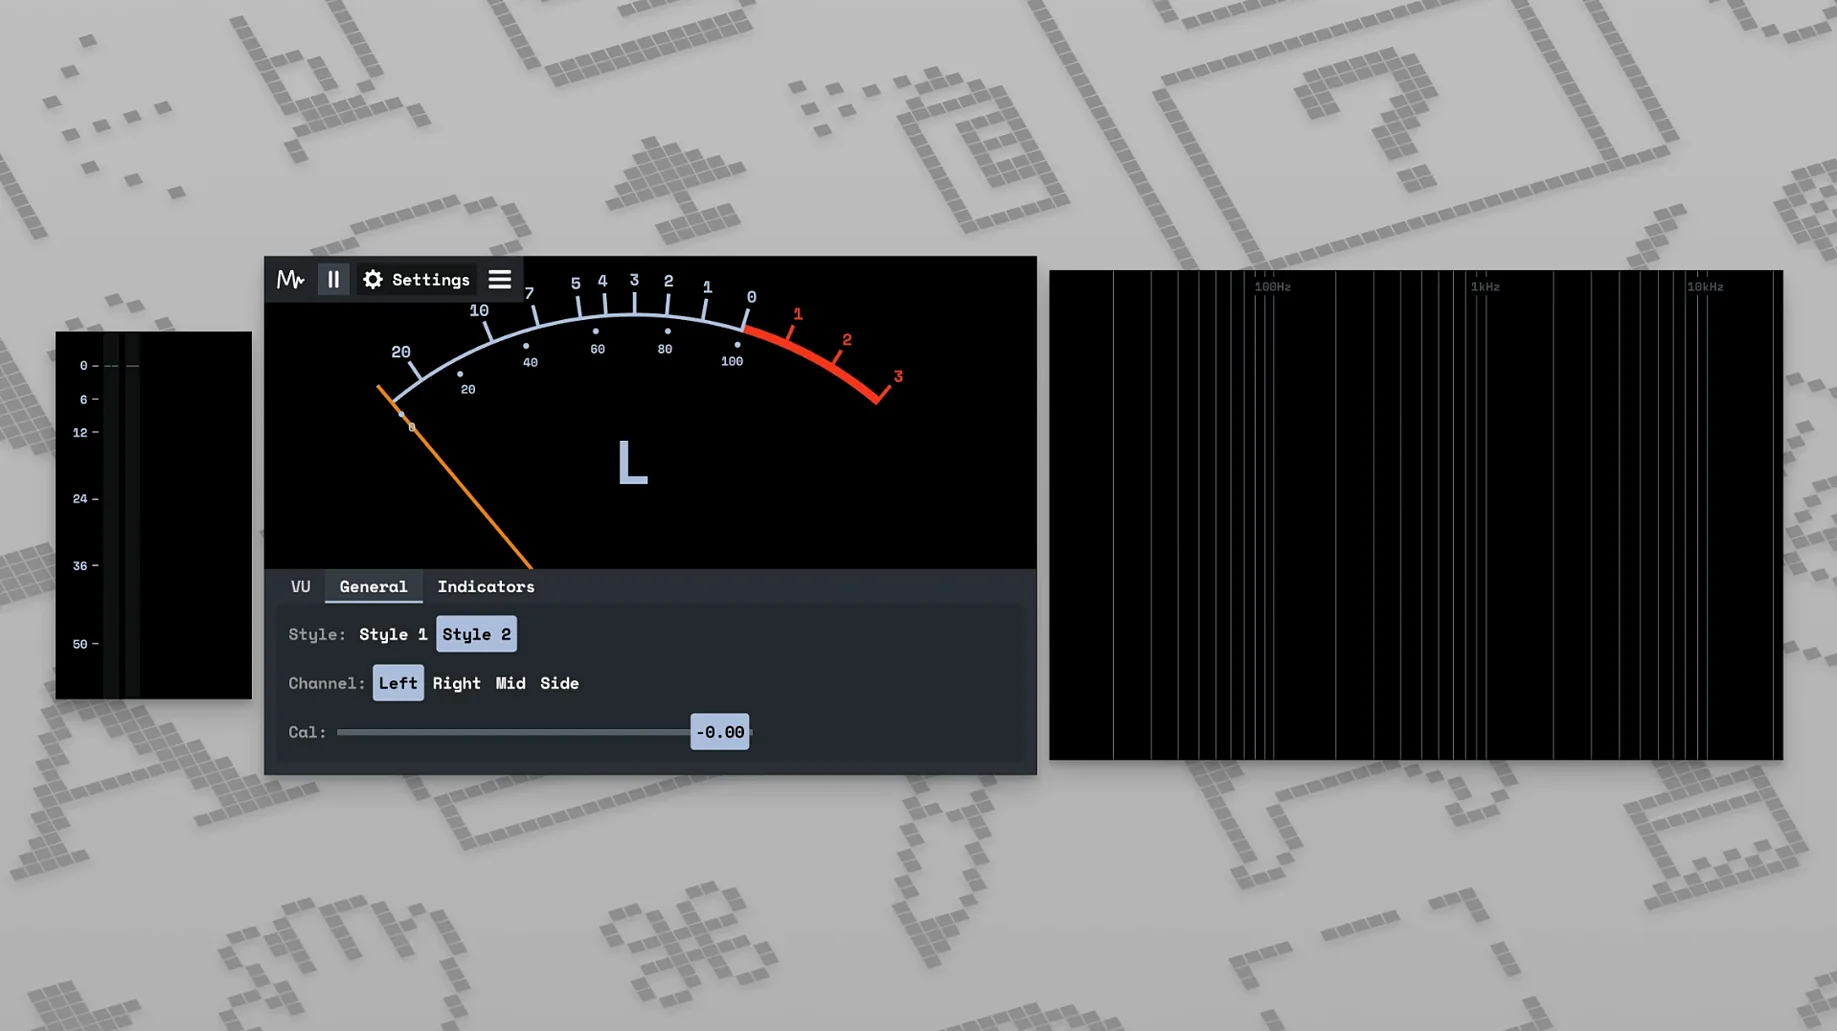
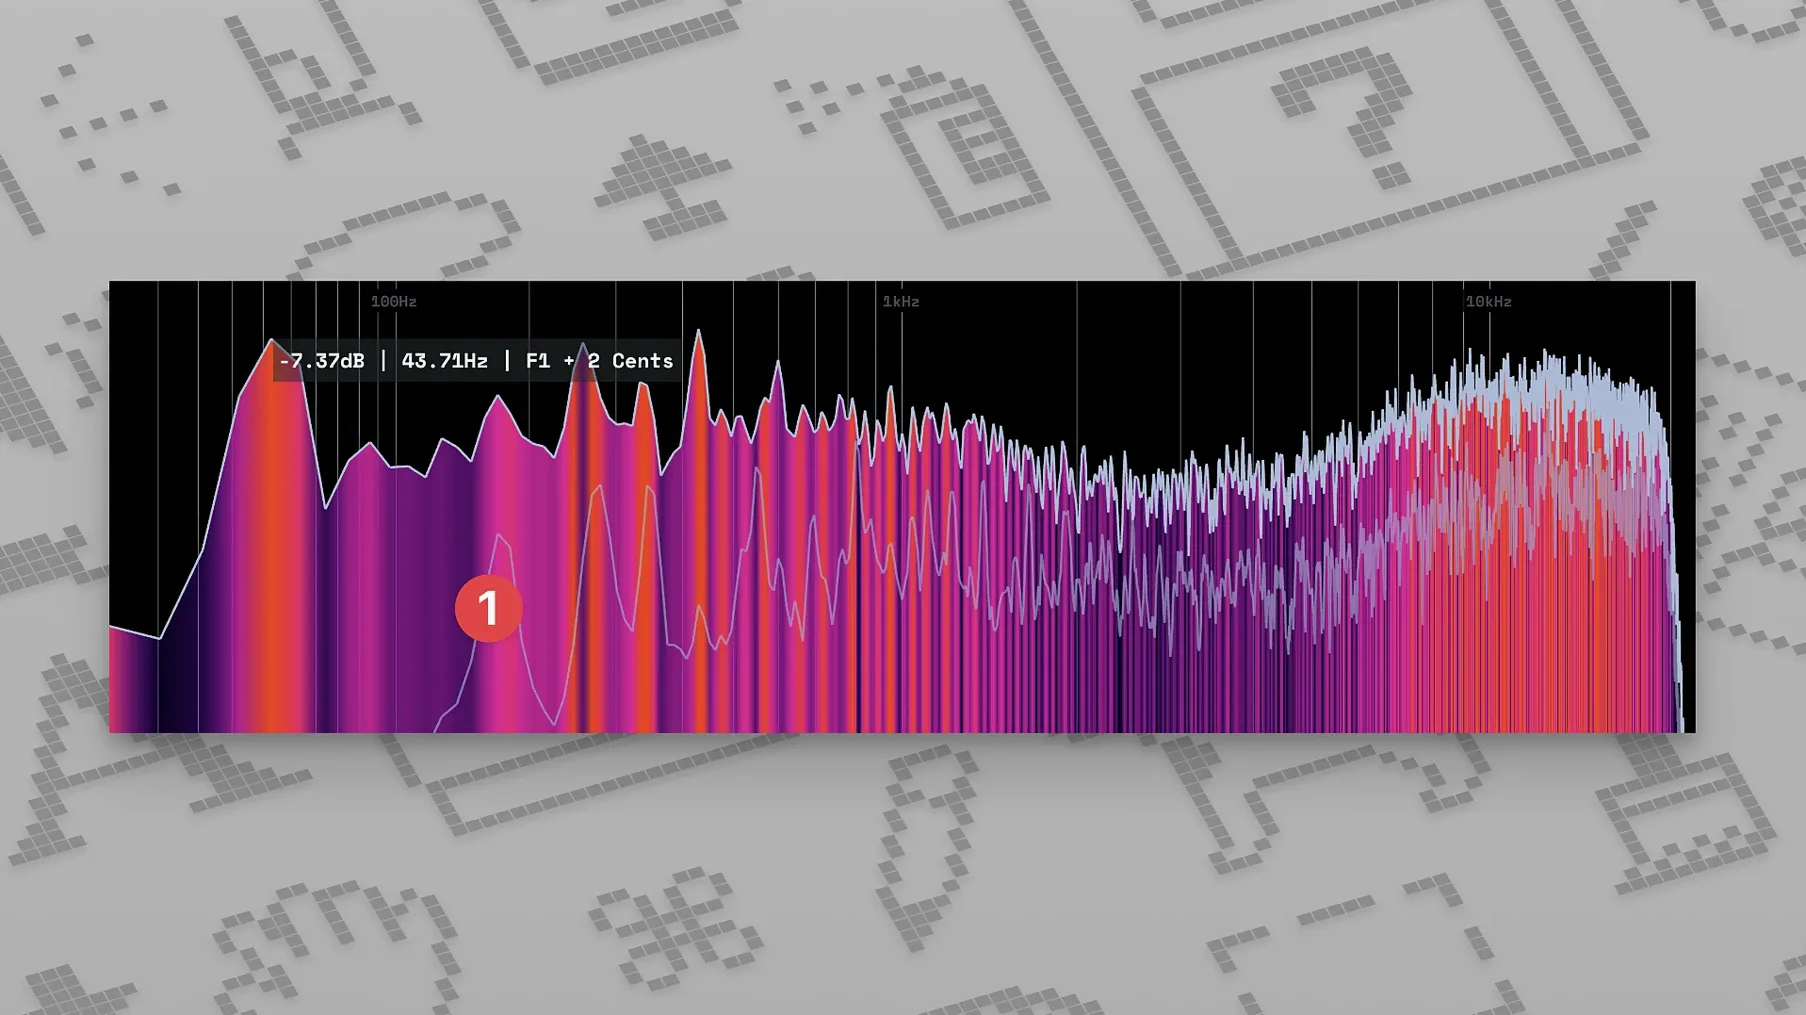
- What metering views are included? A frequency spectrum, a stereo balance meter, and a waveform display are all built in.
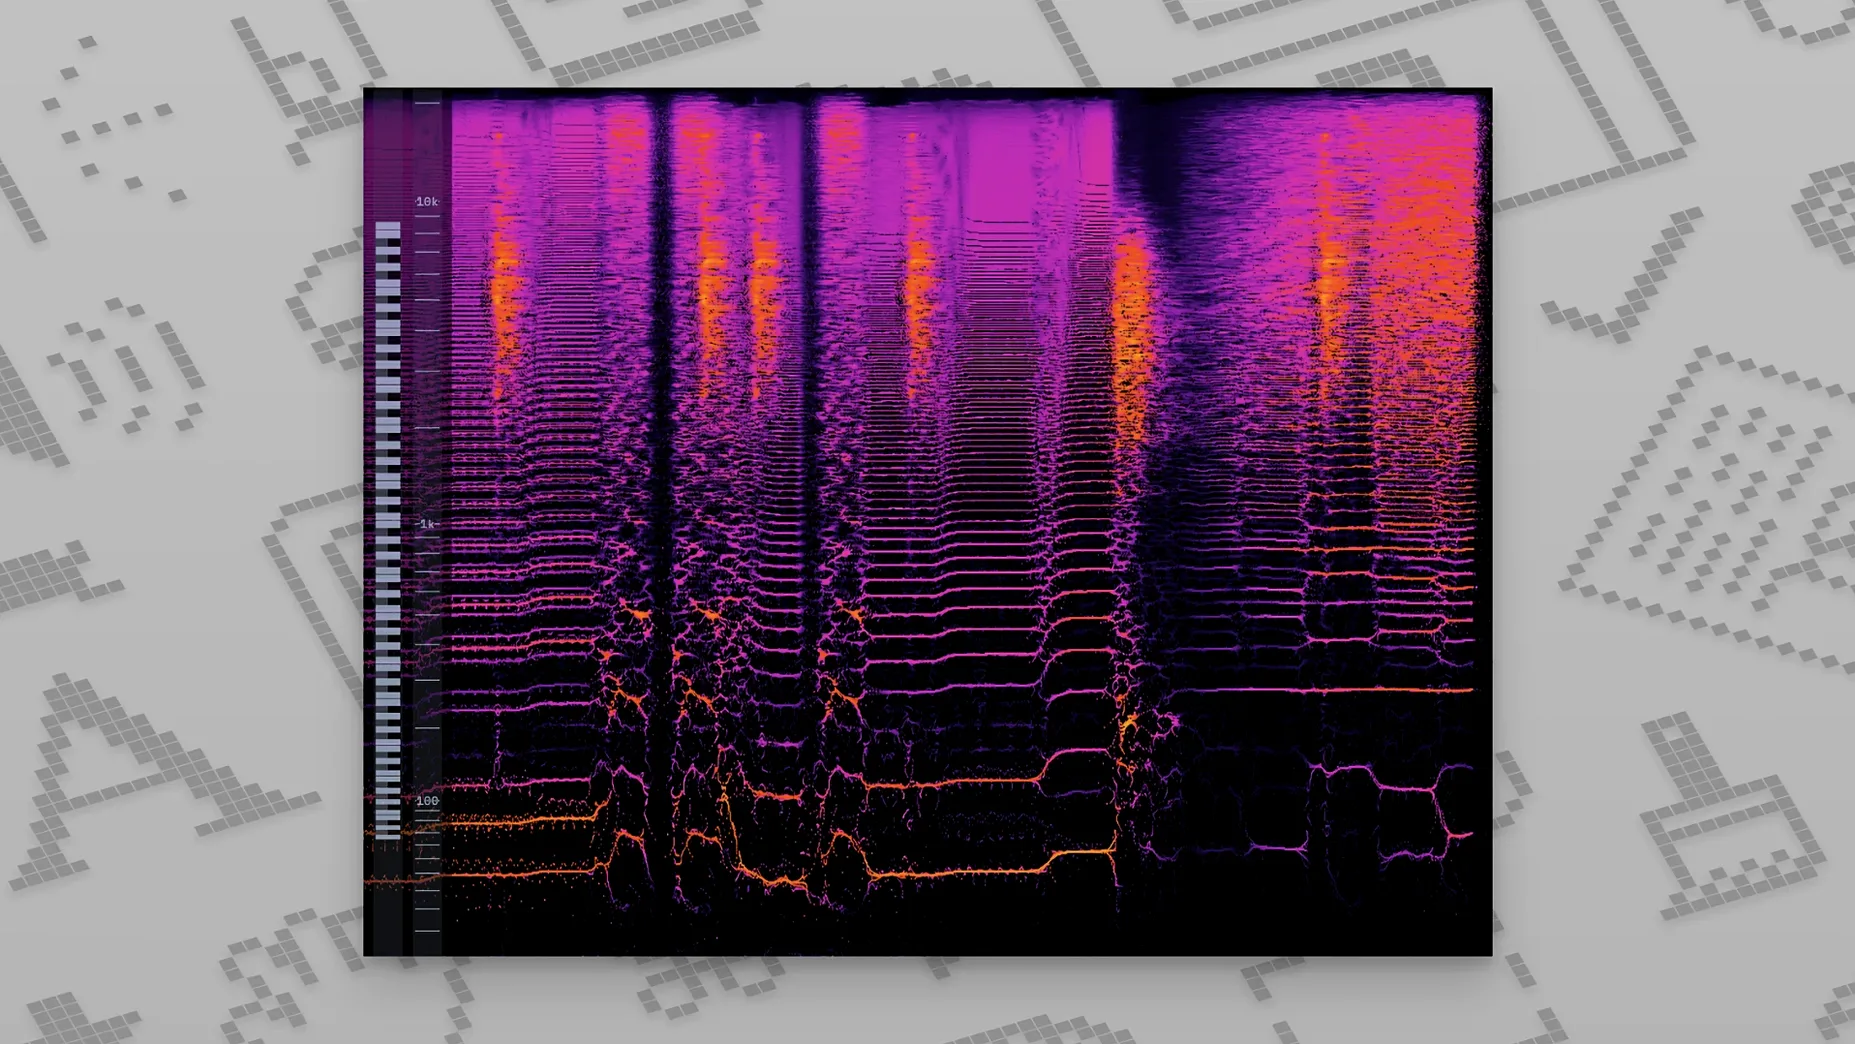
- Is there a spectrogram? Yes, added properly back in v0.8.0.
- Is the loudness metering standardised? The LUFS meter was made spec-compliant from v0.7.0 onward.
- What is the main use case? The developer describes it for mixing, mastering, and comparing against reference tracks.
The version 1.0.30 update focused on stability rather than new features, squashing several long-standing bugs and small interface glitches. It remains a straightforward toolset without extra frills.
MiniMeters vs Similar Mac Metering Tools
Three other applications tend to come up when producers ask about compact metering on macOS: SPAN by Voxengo, Youlean Loudness Meter 2, and Levels by Mastering The Mix. None is a direct clone, and each pulls in a slightly different direction.
SPAN is a free spectrum analyser, pure and simple. It does one view extremely well — configurable FFT with mid/side mode, correlation metering, and a rolling history. No LUFS, no waveform, no standalone system-audio mode. If your only gap is frequency visualisation, SPAN covers it. MiniMeters packages four views into one window and adds the standalone server path, which SPAN does not attempt.
Youlean Loudness Meter 2 specialises in loudness compliance. It measures integrated, short-term, and momentary LUFS alongside true peak and loudness range. The free tier already handles EBU R128, ITU-R BS.1770-4, and several broadcast presets. What it does not do is spectrogram, waveform, or stereo balance outside a host. Youlean is a loudness specialist; MiniMeters is a general monitoring panel.
Levels by Mastering The Mix wraps metering in prescriptive advice — traffic-light indicators for headroom, dynamic range, stereo width, and bass space. It talks back to the user with suggestions. MiniMeters stays silent; it draws the numbers and shapes, then leaves interpretation to the engineer. Someone who wants a second opinion on a mix might lean toward Levels. Someone who just wants the readouts, fast and configurable, will find MiniMeters closer to a hardware meter bridge.
Rescuing a Dense Late-Night Mix
Imagine a producer opening a half-finished mix at 10 pm on a Thursday. The arrangement is dense — three synth layers, a bassline with sub content, two drum buses, and a lead vocal that fights the upper mids. The stereo field feels lopsided, and the low end is a guess on headphones.
1. Launch the server. MiniMetersServer goes live first. It sits in the menu bar, waiting for a connection. The DAW project opens next, and a short routing step inside the host sends the master bus to the MiniMeters virtual input — one plugin instance on the stereo out, nothing more.
2. Glance at the stereo meter. The balance dot hovers left of centre during the chorus. A synth pad with wide unison is pulling the image off-axis. The producer narrows its stereo spread by 20% and watches the dot settle.
3. Check the spectrum. A bump around 240 Hz is visible — the bassline fundamental and a tom fill are stacking. A gentle 2.5 dB dip on the bass channel clears it. The spectrum trace flattens slightly, no new holes appear.
4. Read the LUFS meter. Integrated loudness sits at -11.4 LUFS after two minutes of playback. The short-term window jumps to -9.2 on the loudest chorus. The target for this project is -14 LUFS integrated for a streaming draft, so the producer pulls the master fader by 3 dB and re-checks. Integrated drifts toward -14.0 after another pass.
5. Scan the waveform view. Two snare hits in the bridge clip near +0.3 dBTP. A limiter threshold adjustment of 0.5 dB catches them. The waveform redraws without those sharp peaks.
6. Switch to system audio for reference. The producer closes the DAW project, opens MiniMeters in standalone mode, and plays a commercial track from a lossless file. Spectrum balance, stereo width, and integrated LUFS all sit in a different ballpark — useful data, not a prescription. Notes go into a text file. Back to the mix.
Observing Movement Instead of Chasing a Flat Line
Most early missteps with MiniMeters come from treating it as a corrective tool rather than an observational one. The first mistake is chasing the spectrum trace. A flat line looks satisfying but rarely sounds musical. Beginners often cut every peak until the display resembles pink noise, then wonder why the mix lost its weight. The spectrum shows what is present, not what is wrong.
Another common error is ignoring the server routing. A user installs the plugin, inserts it on a track, and sees no movement. MiniMetersServer needs to be running — it is a separate process that shuttles audio from the plugin to the display. Forgetting to start it, or closing it by accident, breaks the entire measurement chain. The display sits blank and the user assumes the plugin is faulty.
Reading LUFS without context trips up newcomers as well. A short-term reading of -10 LUFS on a chorus says nothing about the verse; a single number pulled from the loudest section does not represent the track. Beginners sometimes adjust an entire mix based on one momentary value and end up with a quiet, lifeless arrangement. Integrated LUFS across the full song length is the figure that matters for loudness normalisation.
The standalone vs plugin confusion also appears early. Standalone mode captures whatever macOS sends to the selected output device — great for reference tracks and streaming analysis. But a user who plays a YouTube video while the DAW plugin is active will see two unrelated signal paths and no combined reading. Understanding which mode feeds which audio source prevents a lot of head-scratching.
Headphone Producers Need a Visual Reality Check
Self-mixing producers on headphones gain the most immediate benefit. Headphone monitoring masks stereo balance issues and low-end buildup that nearfields reveal instantly. The stereo meter and spectrum display act as a visual reality check when the acoustic environment cannot be trusted. A producer working late at night in an untreated room can spot a 4 dB left-channel bias that headphones alone would never flag.
Mastering engineers who need a second screen also extract real value. A mastering chain already feeds hardware meters or a dedicated loudness monitor, but MiniMeters running on a separate display provides a redundant check that costs no rack space. The spectrogram view, in particular, helps catch intermittent low-frequency noise — a furnace rumble or a foot tap — that a numerical LUFS readout would average away.
Educators and students in audio courses find the all-in-one layout useful for demonstration. Four metering types on one screen means fewer window switches during a lesson. An instructor can point to the waveform while discussing transient shaping, then glance at LUFS for loudness context, without bouncing between three different plugins.
Users who will probably not connect with MiniMeters are those who want prescriptive mix feedback. The tool draws the data; it does not suggest EQ curves, compression ratios, or stereo-width targets. Someone looking for a plugin that says “reduce 400 Hz by 2 dB” will leave disappointed.
Workflow: Checking a Podcast Mix for Loudness Compliance
A spoken-word producer needs to deliver an episode at -16 LUFS integrated with a -1.0 dBTP true peak ceiling, per common podcast platform guidelines. The raw recording is a 45-minute interview with two voices, some chair squeaks, and a section of applause at the end.
1. Route the master bus. The producer inserts the MiniMeters plugin on the DAW master channel and confirms MiniMetersServer is active. The standalone app opens on a secondary display.
2. Solo the dialogue section first. Applause will skew the integrated reading, so the producer bypasses the final two minutes and plays from 02:00 to 43:00. The LUFS meter shows integrated at -18.2 LUFS — too quiet. A gain plugin before the limiter adds 2.5 dB of clean level. A second pass reads -15.7 LUFS integrated.
3. Check true peak. With the limiter ceiling set at -1.0 dBTP, the waveform view shows one peak at -0.4 — a loud consonant from the guest’s closer microphone. The producer nudges the limiter input by 0.3 dB and the peak tucks under -1.0.
4. Measure the full file with applause. The producer un-bypasses the ending and runs the entire 45-minute timeline. Integrated LUFS climbs to -15.2 because the applause section is dense. A small gain reduction of 0.8 dB on the master brings the full-file integrated reading to -16.1 LUFS, close enough for the spec. Short-term LUFS during applause peaks at -12.4 but never triggers a short-term violation under the platform’s rules.
5. Export and verify. The producer bounces a 48 kHz WAV, opens MiniMeters in standalone mode, and plays the file back through system audio. The integrated LUFS matches the DAW reading within 0.1 dB. The file meets the delivery spec without guesswork.
- Bug fixes — long-standing bugs and small UI issues resolved in v1.0.30.
- macOS 10.15 or newer
- Intel or Apple Silicon Mac
Sign in · Create an account to add a field note.
No field notes yet. A measurement, a version, a machine — they appear after moderation.